

Question: Please use the table in the image to explain each of the three questions. Voter Type A B C D F F G H Percent
Please use the table in the image to explain each of the three questions.
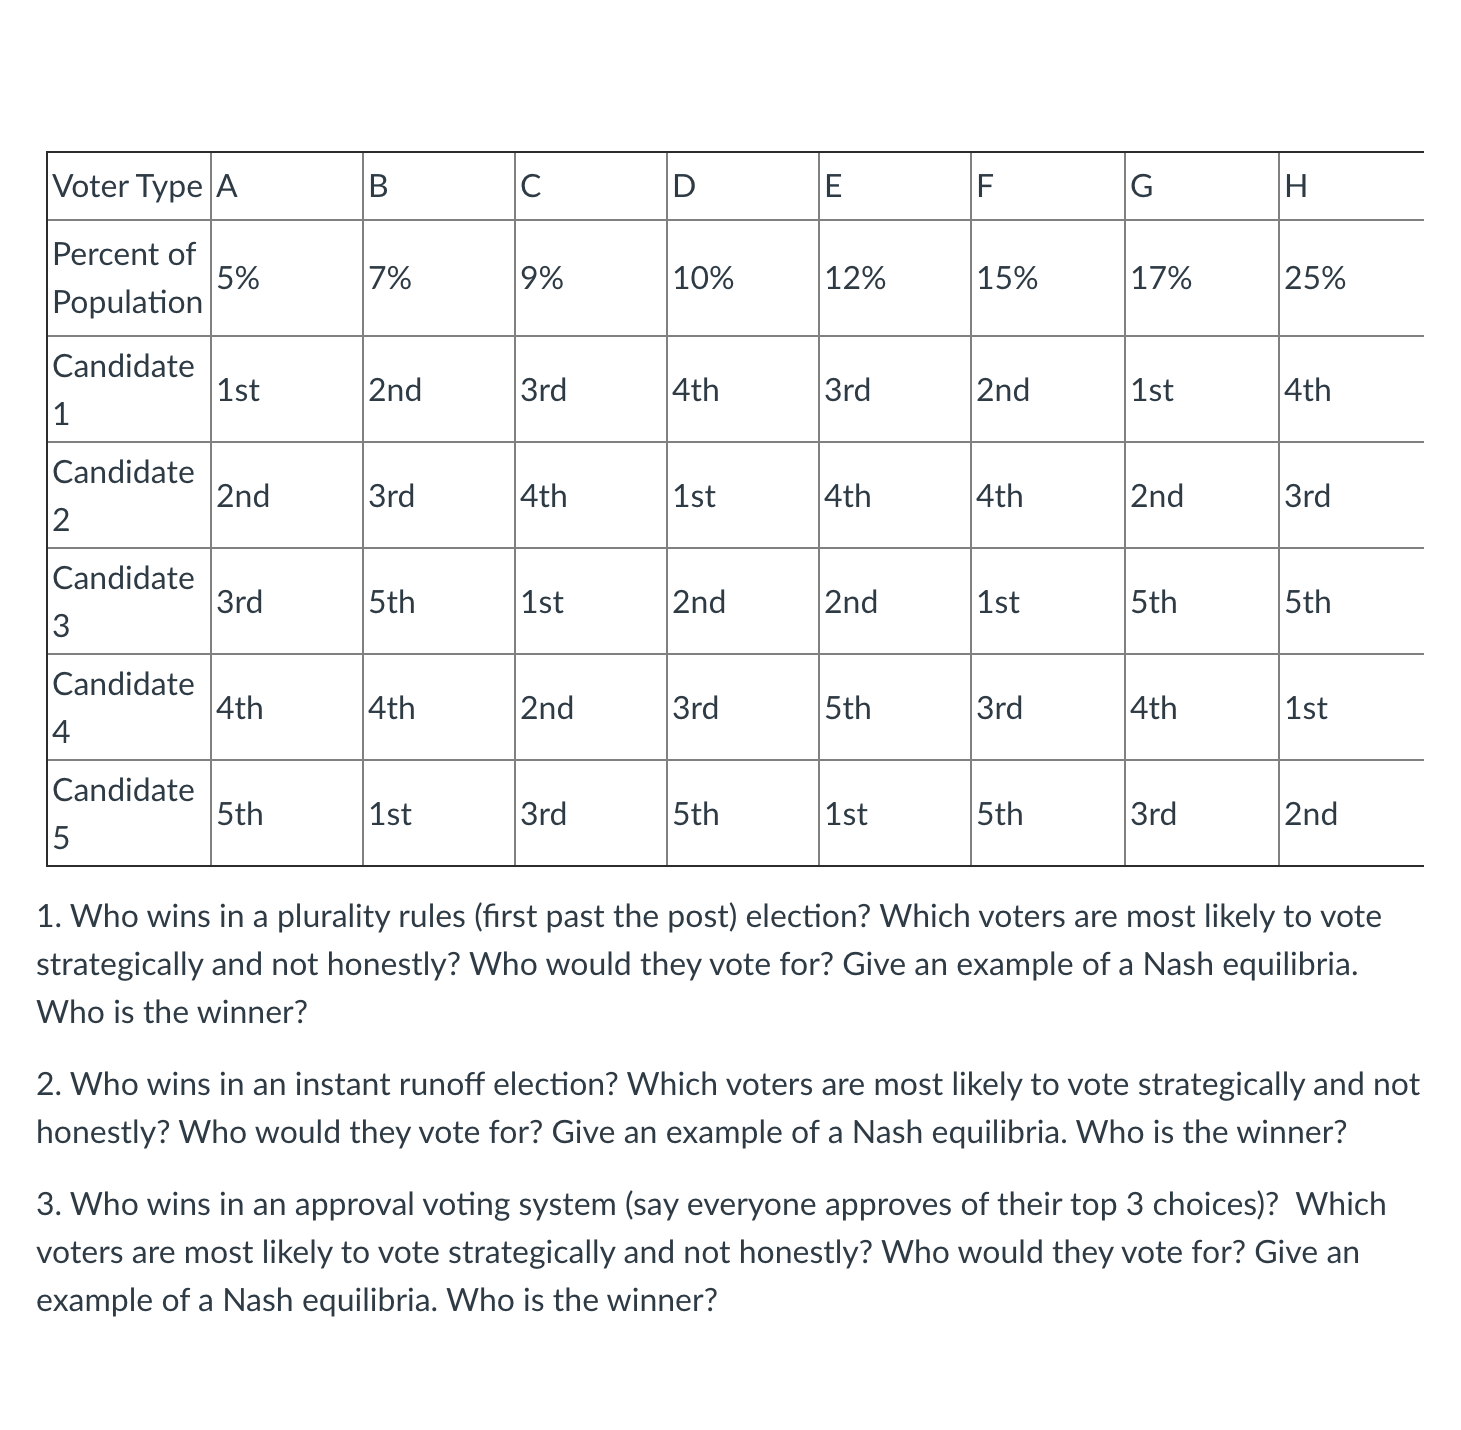
Voter Type A B C D F F G H Percent of Population 5% 7% 9% 10% 12% 15% 17% 25% Candidate 1 1st 2nd 3rd 4th 3rd 2nd 1st 4th Candidate 2 2nd 3rd 4th 1st 4th 4th 2nd 3rd Candidate 3rd 1st 2nd 2nd 1st 3 5th 5th 5th Candidate 14th 4th 4th 4 2nd 3rd 5th 3rd 1st Candidate 5 5th 1st 3rd 5th 1st 5th 3rd 2nd 1. Who wins in a plurality rules (first past the post) election? Which voters are most likely to vote strategically and not honestly? Who would they vote for? Give an example of a Nash equilibria. Who is the winner? 2. Who wins in an instant runoff election? Which voters are most likely to vote strategically and not honestly? Who would they vote for? Give an example of a Nash equilibria. Who is the winner? 3. Who wins in an approval voting system (say everyone approves of their top 3 choices)? Which voters are most likely to vote strategically and not honestly? Who would they vote for? Give an example of a Nash equilibria. Who is the winner
Step by Step Solution
There are 3 Steps involved in it

Get step-by-step solutions from verified subject matter experts