

Question: Please use the template below to answer the question Gather adjusted month end prices for a 10-stock portfolio consisting of the stocks listed below for
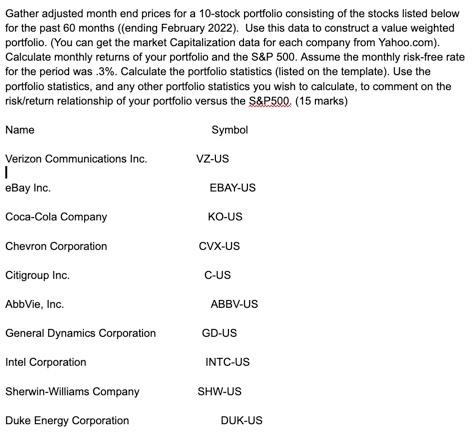
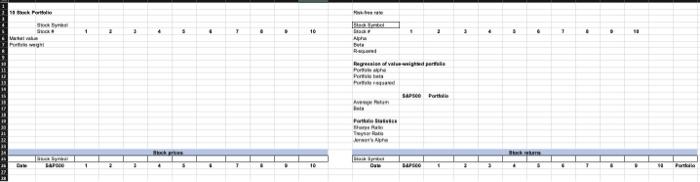
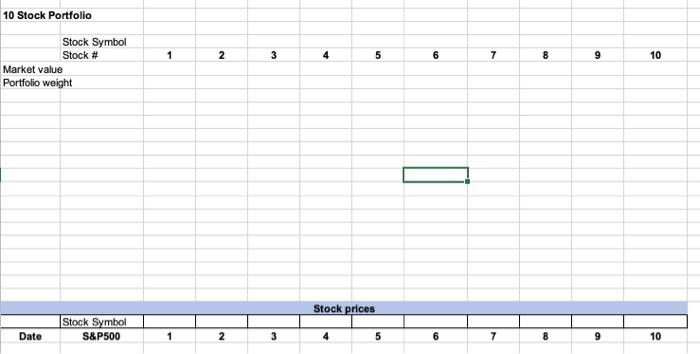
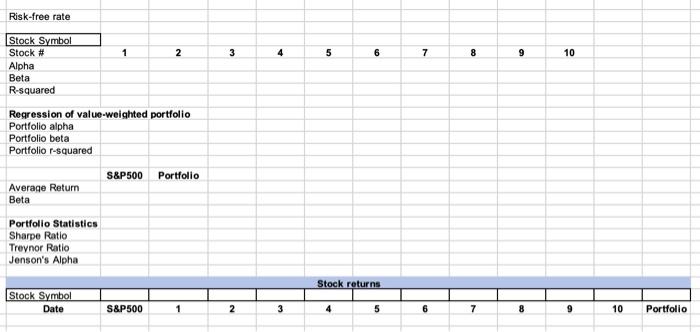
Gather adjusted month end prices for a 10-stock portfolio consisting of the stocks listed below for the past 60 months ((ending February 2022). Use this data to construct a value weighted portfolio. (You can get the market Capitalization data for each company from Yahoo.com). Calculate monthly returns of your portfolio and the S&P 500. Assume the monthly risk-free rate for the period was.3%. Calculate the portfolio statistics (listed on the template). Use the portfolio statistics, and any other portfolio statistics you wish to calculate, to comment on the risk/return relationship of your portfolio versus the S&P500 (15 marks) Name Symbol VZ-US Verizon Communications Inc. 1 eBay Inc. Coca-Cola Company EBAY-US KO-US CVX-US Chevron Corporation Citigroup Inc. C-US AbbVie, Inc. ABBV-US GD-US INTC-US General Dynamics Corporation Intel Corporation Sherwin-Williams Company - Duke Energy Corporation SHW-US DUK-US 1 . . . 16 . 3 . See ta Bar Apre Regreso Vendere SA Fort Ini Terme LE 10 Stock Portfolio 1 1 N 4 5 6 7 7 8 9 10 Stock Symbol Stock # Market value Portfolio weight Stock prices Stock Symbol S&P500 Date 1 2 3 4 5 6 7 8 9 10 Risk-free rate 1 2 3 4 4 5 6 an 7 7 8 9 9 10 Stock Symbol Stock # Alpha Beta R-squared Regression of value-weighted portfolio Portfolio alpha Portfolio beta Portfolio r-squared S&P500 Portfolio Average Return Beta Portfolio Statistics Sharpe Ratio Treynor Ratio Jenson's Alpha Stock returns Stock Symbol Date S&P500 1 2 3 4 5 6 7 8 9 10 Portfolio Gather adjusted month end prices for a 10-stock portfolio consisting of the stocks listed below for the past 60 months ((ending February 2022). Use this data to construct a value weighted portfolio. (You can get the market Capitalization data for each company from Yahoo.com). Calculate monthly returns of your portfolio and the S&P 500. Assume the monthly risk-free rate for the period was.3%. Calculate the portfolio statistics (listed on the template). Use the portfolio statistics, and any other portfolio statistics you wish to calculate, to comment on the risk/return relationship of your portfolio versus the S&P500 (15 marks) Name Symbol VZ-US Verizon Communications Inc. 1 eBay Inc. Coca-Cola Company EBAY-US KO-US CVX-US Chevron Corporation Citigroup Inc. C-US AbbVie, Inc. ABBV-US GD-US INTC-US General Dynamics Corporation Intel Corporation Sherwin-Williams Company - Duke Energy Corporation SHW-US DUK-US 1 . . . 16 . 3 . See ta Bar Apre Regreso Vendere SA Fort Ini Terme LE 10 Stock Portfolio 1 1 N 4 5 6 7 7 8 9 10 Stock Symbol Stock # Market value Portfolio weight Stock prices Stock Symbol S&P500 Date 1 2 3 4 5 6 7 8 9 10 Risk-free rate 1 2 3 4 4 5 6 an 7 7 8 9 9 10 Stock Symbol Stock # Alpha Beta R-squared Regression of value-weighted portfolio Portfolio alpha Portfolio beta Portfolio r-squared S&P500 Portfolio Average Return Beta Portfolio Statistics Sharpe Ratio Treynor Ratio Jenson's Alpha Stock returns Stock Symbol Date S&P500 1 2 3 4 5 6 7 8 9 10 Portfolio
Step by Step Solution
There are 3 Steps involved in it

Get step-by-step solutions from verified subject matter experts