

Question: Please use these graphs to answer the following question List of Graphs: Supply / Demand Curve Shifts in the Foreign Exchange (FX) Market In each
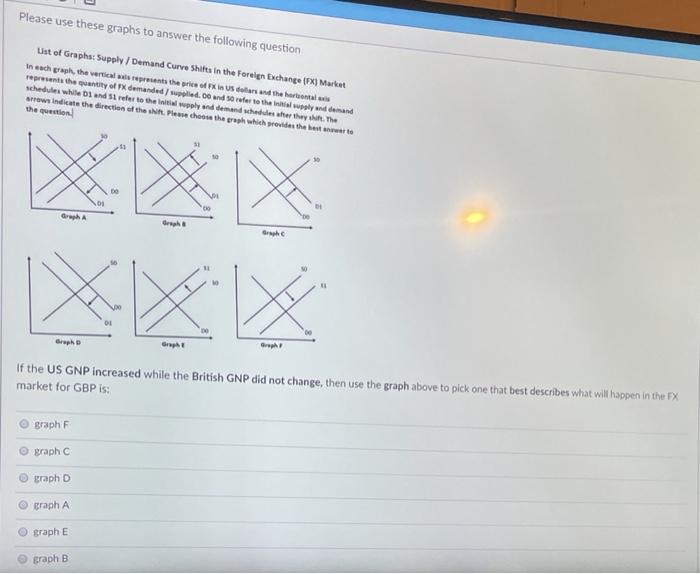
Please use these graphs to answer the following question List of Graphs: Supply / Demand Curve Shifts in the Foreign Exchange (FX) Market In each graph, the vertical represents the price of FX in US dollars and the herontal represents the quantity of demanded ped. und so refer to the initially and demand schedule while D3 and refer to the apply and demand schedules her that. The arrow indicate the direction of the spese choose the graph which provides the best warto the question Graph Graph Graph Graph Graph If the US GNP increased while the British GNP did not change, then use the graph above to pick one that best describes what will happen in the FX market for GBP is Braph F graph C graph D graph A graph E graph B Please use these graphs to answer the following question List of Graphs: Supply / Demand Curve Shifts in the Foreign Exchange (FX) Market In each graph, the vertical represents the price of FX in US dollars and the herontal represents the quantity of demanded ped. und so refer to the initially and demand schedule while D3 and refer to the apply and demand schedules her that. The arrow indicate the direction of the spese choose the graph which provides the best warto the question Graph Graph Graph Graph Graph If the US GNP increased while the British GNP did not change, then use the graph above to pick one that best describes what will happen in the FX market for GBP is Braph F graph C graph D graph A graph E graph B
Step by Step Solution
There are 3 Steps involved in it

Get step-by-step solutions from verified subject matter experts