

Question: please use these numbers and not just post another one!! Thank you!! Excel Online Structured Activity: Statistical Control - Rice Production A company produces 8-pound
please use these numbers and not just post another one!! Thank you!! 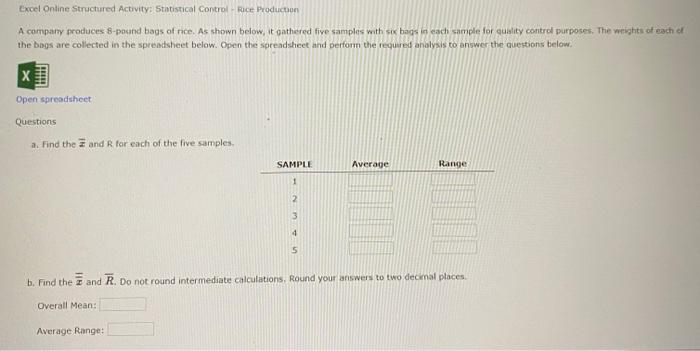
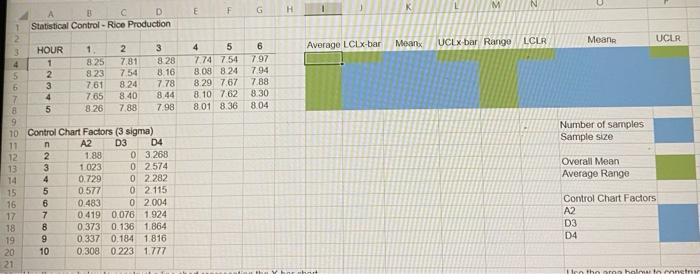
Excel Online Structured Activity: Statistical Control - Rice Production A company produces 8-pound bags of nice. As shown below, it gathered five samples with sex bags in each sample for quality control purposes. The weights of each of the bags are collected in the spreadsheet below. Open the spreadsheet and perform the required analysis to answer the questions below. Open spreadsheet Questions a. Find the and R for each of the five samples, SAMPLE Average Range 1 2 3 4 5 b. Find the Band R. Do not round intermediate calculations. Round your answers to two decimal places Overall Mean: Average Range: M G E N H Meanx UCLX-bar Range Average LCLX-bar Mons LCLR UCLR 754 4 5 7.74 754 8.08 8.24 8.29 767 8.10 7.62 8.01 8.36 6 7.97 7.94 7.88 8.30 804 c D Statistical Control - Rice Production 2 3 HOUR 1 2 3 4 1 825 7.81 828 5 2 823 8 16 3 761 8.24 7.78 7 4 7.65 8.40 8.44 8 5 8.26 788 7.98 9 10 Control Chart Factors (3 sigma) 11 n A2 D3 04 12 2 1.88 0 3.268 13 3 1.023 0 2574 14 4 0.729 0 2.282 15 5 0.577 0 2 115 16 6 0.483 0 2004 17 7 0.419 0.076 1.924 18 0.373 0.136 1864 19 9 0.337 0.184 1816 20 10 0.308 0.223 1777 21 Number of samples Sample size Overall Mean Average Range 00 N Control Chart Factors A2 D3 D4 to the holesternstra Step by Step Solution
There are 3 Steps involved in it
1 Expert Approved Answer
Step: 1 Unlock

Question Has Been Solved by an Expert!
Get step-by-step solutions from verified subject matter experts
Step: 2 Unlock
Step: 3 Unlock