

Question: Please use this dataset to conduct a test for both assuming Equal and Unequal Variances. (I really need help with interpreting the results in regard
Please use this dataset to conduct a test for both assuming Equal and Unequal Variances.
(I really need help with interpreting the results in regard to the null hypothesis, alternative hypothesis and the result of the hypothesis test)
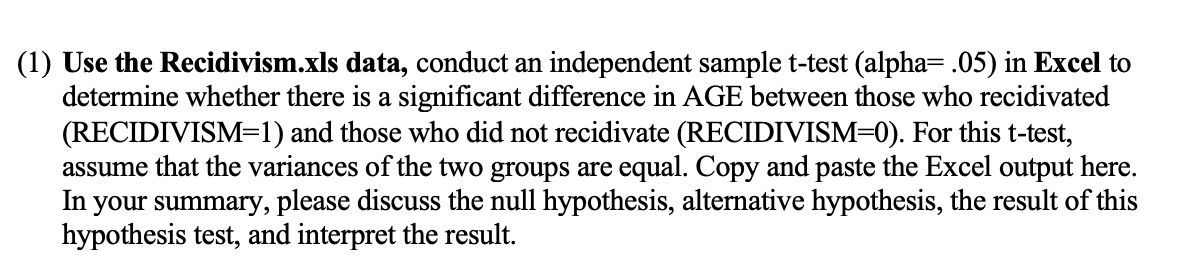
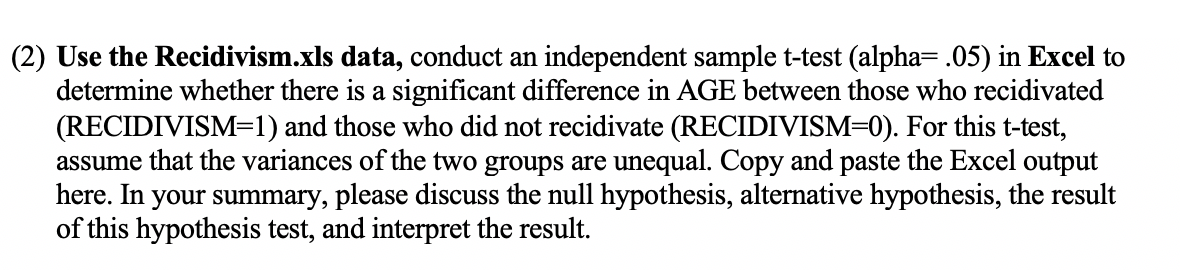
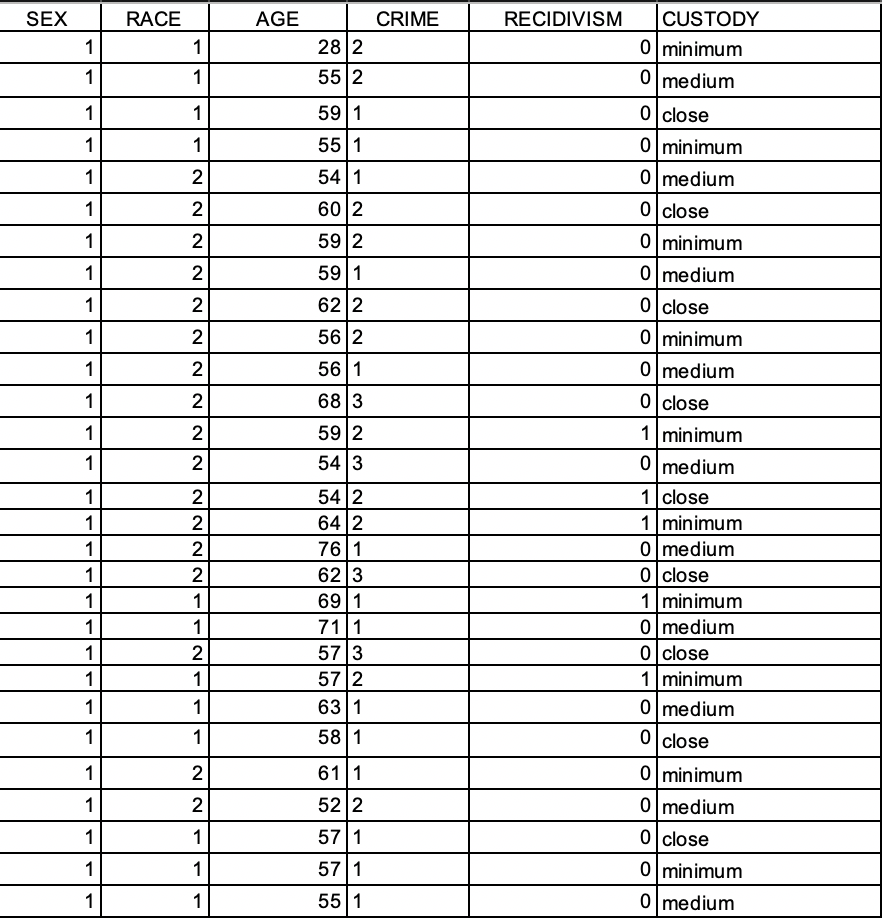
(1) Use the Recidivismarls data, conduct an independent sample t-test(a1pha= .05) in Excel to determine Whether there is a signicant difference in AGE between those who recidivated (RECIDIVISM=1) and those who did not recidivate (RECIDIVISM=0). For this t-test, assume that the variances of the two groups are equal. Copy and paste the Excel output here. In your summary, please discuss the null hypothesis, alternative hypothesis, the result of this hypothesis test, and interpret the result. (2) Use the Recidivismxls data, conduct an independent sample t-test (alpha= .05) in Excel to determine whether there is a signicant difference in AGE between those who recidivated (RECIDIVISM=1) and those who did not recidivate (RECIDIVISM=0). For this t-test, assume that the variances of the two groups are unequal. Copy and paste the Excel output here. In your summary, please discuss the null hypothesis, alternative hypothesis, the result of this hypothesis test, and interpret the result. SEX RACE AGE CRIME RECIDIVISM CUSTODY 28 2 0 minimum 55 12 medium 1 59 1 0 close 1 55 1 0 minimum 2 - N - - NN NN NN NN NN NN NI 54 1 0 medium 60|2 0 close 59 2 0 minimum 59 1 0 medium 62 2 0 close 56 2 0 minimum 56 1 0 medium 68 3 0 close 59 2 1 minimum 54 3 medium 54 2 1 close 64 2 1 |minimum 76 1 0 medium 62 3 0 close 69 1 1 |minimum 71 1 0 medium 57 3 0 close 57 2 1 minimum 63 1 0 medium 58 1 0 close 2 61 1 0 minimum N 52 2 0 medium 57 1 0 close 57 1 0 minimum 55 1 0|medium
Step by Step Solution
There are 3 Steps involved in it

Get step-by-step solutions from verified subject matter experts