

Question: Please use this information and create control chart (use Excel) 3. A small, independent amusement park collects data on the number of cars with out-of-state
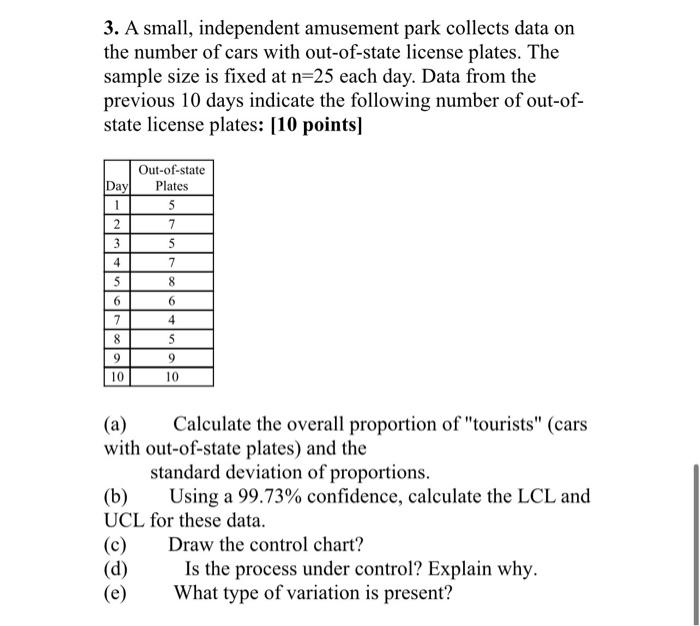
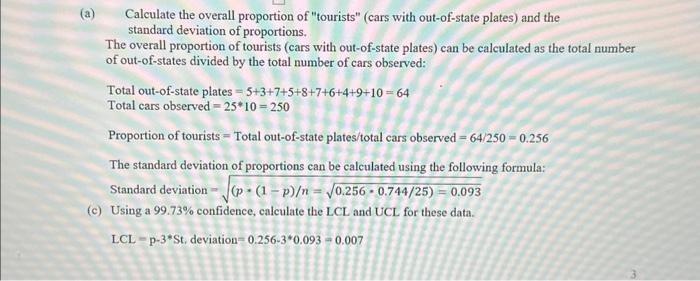
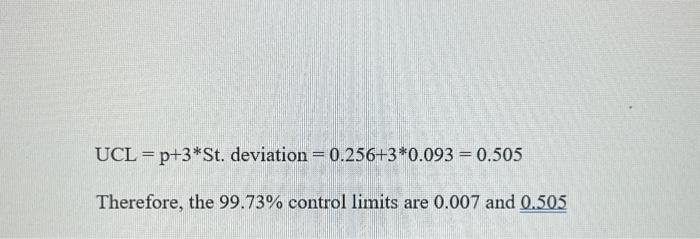
3. A small, independent amusement park collects data on the number of cars with out-of-state license plates. The sample size is fixed at n=25 each day. Data from the previous 10 days indicate the following number of out-ofstate license plates: [10 points] (a) Calculate the overall proportion of "tourists" (cars with out-of-state plates) and the standard deviation of proportions. (b) Using a 99.73% confidence, calculate the LCL and UCL for these data. (c) Draw the control chart? (d) Is the process under control? Explain why. (e) What type of variation is present? (a) Calculate the overall proportion of "tourists" (cars with out-of-state plates) and the standard deviation of proportions. The overall proportion of tourists (cars with out-of-state plates) can be calculated as the total number of out-of-states divided by the total number of cars observed: Total out-of-state plates =5+3+7+5+8+7+6+4+9+10=64 Total cars observed =2510=250 Proportion of tourists = Total out-of-state plates / total cars observed =64/250=0.256 The standard deviation of proportions can be calculated using the following formula: Standard deviation =(p(1p)=0.2560.744/25)=0.093 (c) Using a 99.73% confidence, calculate the LCL and UCL for these data. LCL = p- 3 St, deviation =0.25630.093=0.007 UCL=p+3St.deviation=0.256+30.093=0.505 Therefore, the 99.73% control limits are 0.007 and 0.505
Step by Step Solution
There are 3 Steps involved in it

Get step-by-step solutions from verified subject matter experts