

Question: Please use this link to help you with these questions https://docs.google.com/spreadsheets/d/16QUO44CSnnPZgEOTPlGudkB_Yjkh4u1ae3Z5QCpkirM/edit?usp=sharing 67Use the linked data to answer questions 1 and 2. Data data by B.Singleton
Please use this link to help you with these questions https://docs.google.com/spreadsheets/d/16QUO44CSnnPZgEOTPlGudkB_Yjkh4u1ae3Z5QCpkirM/edit?usp=sharing
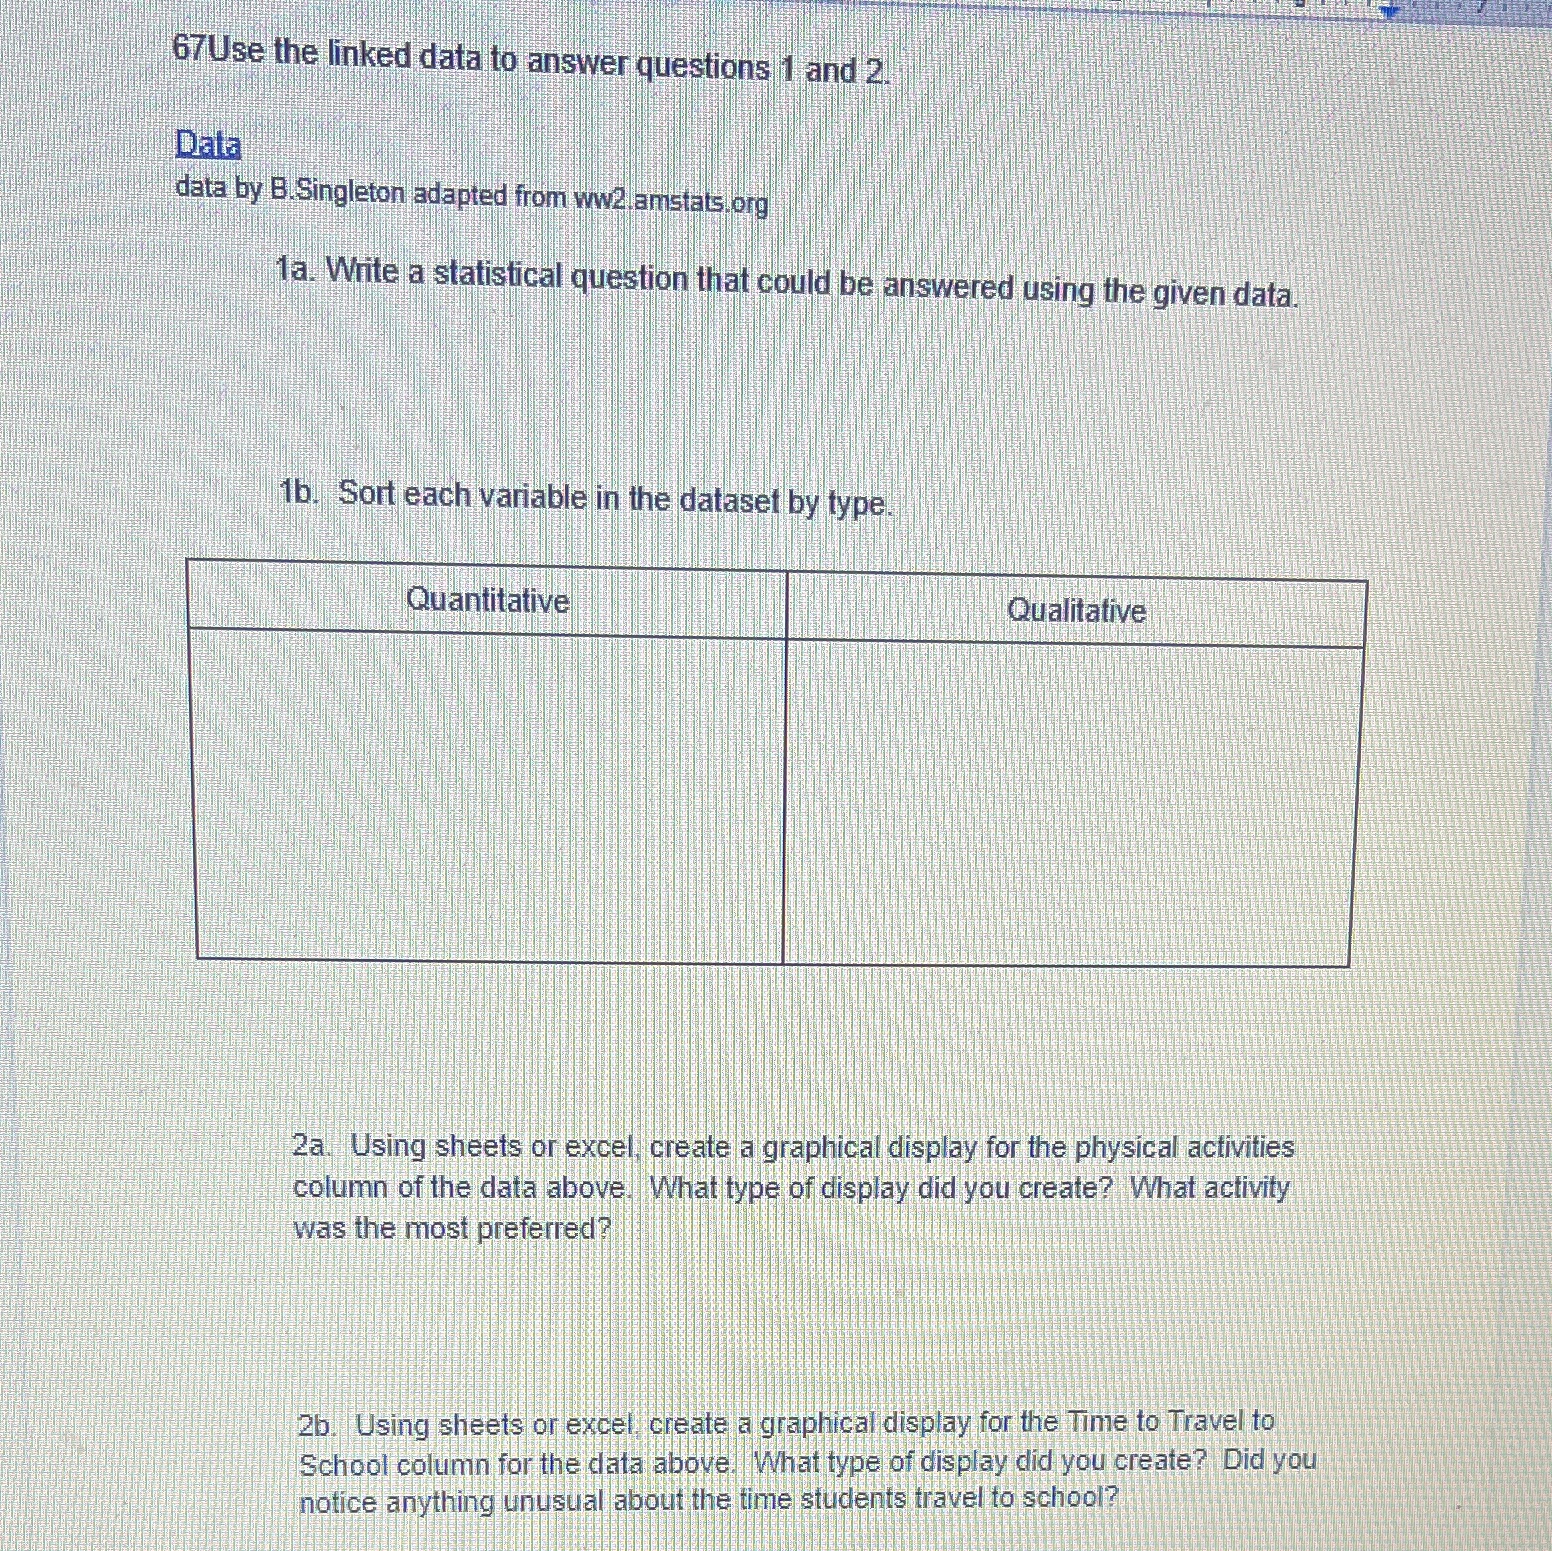
67Use the linked data to answer questions 1 and 2. Data data by B.Singleton adapted from ww2 amstats.org 1a. Write a statistical question that could be answered using the given data 1b. Sort each variable in the dataset by type. Quantitative Qualitative 2a. Using sheets or excel, create a graphical display for the physical activities column of the data above. What type of display did you create? What activity was the most preferred? 2b. Using sheets or excel, create a graphical display for the Time to Travel to School column for the data above. What type of display did you create? Did you notice anything unusual about the time students travel to school
Step by Step Solution
There are 3 Steps involved in it

Get step-by-step solutions from verified subject matter experts