

Question: Please use X bar chart to solve this question instead of using R chart. Answer must be typed and provided with complaining. Will upvote if
Please use X bar chart to solve this question instead of using R chart. Answer must be typed and provided with complaining. Will upvote if it works thanks!
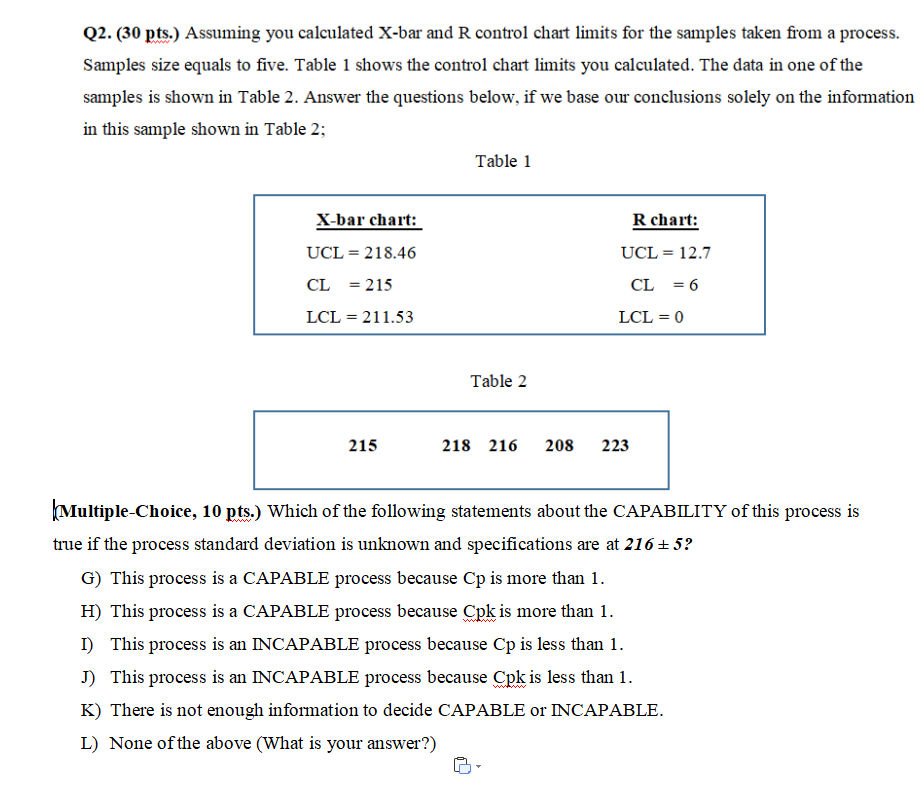
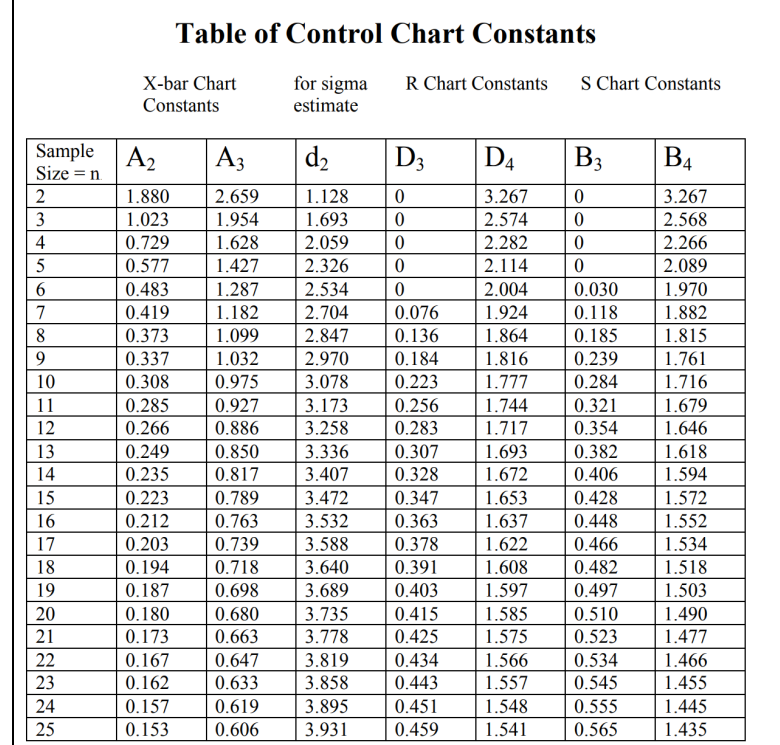
Q2. (30 pts.) Assuming you calculated X-bar and R control chart limits for the samples taken from a process. Samples size equals to five. Table 1 shows the control chart limits you calculated. The data in one of the samples is shown in Table 2. Answer the questions below, if we base our conclusions solely on the information in this sample shown in Table 2; Table 1 R chart: UCL = 12.7 X-bar chart: UCL = 218.46 CL = 215 LCL = 211.53 CL = = 6 LCL = 0 = Table 2 215 218 216 208 223 Multiple-Choice, 10 pts.) Which of the following statements about the CAPABILITY of this process is true if the process standard deviation is unknown and specifications are at 216 + 5? G) This process is a CAPABLE process because Cp is more than 1. H) This process is a CAPABLE process because Cpk is more than 1. I) This process is an INCAPABLE process because Cp is less than 1. J) This process is an INCAPABLE process because Cpk is less than 1. K) There is not enough information to decide CAPABLE or INCAPABLE. L) None of the above (What is your answer?) Table of Control Chart Constants X-bar Chart Constants for sigma estimate R Chart Constants S Chart Constants A2 A3 d2 D3 D4 B3 B4 Sample Size = n 2 3 4 5 6 7 8 9 10 11 12 13 14 15 16 17 18 19 20 21 22 23 24 25 1.880 1.023 0.729 0.577 0.483 0.419 0.373 0.337 0.308 0.285 0.266 0.249 0.235 0.223 0.212 0.203 0.194 0.187 0.180 0.173 0.167 0.162 0.157 0.153 2.659 1.954 1.628 1.427 1.287 1.182 1.099 1.032 0.975 0.927 0.886 0.850 0.817 0.789 0.763 0.739 0.718 0.698 0.680 0.663 0.647 0.633 0.619 0.606 1.128 1.693 2.059 2.326 2.534 2.704 2.847 2.970 3.078 3.173 3.258 3.336 3.407 3.472 3.532 3.588 3.640 3.689 3.735 3.778 3.819 3.858 3.895 3.931 0 0 0 0 0 0.076 0.136 0.184 0.223 0.256 0.283 0.307 0.328 0.347 0.363 0.378 0.391 0.403 0.415 0.425 0.434 0.443 0.451 0.459 3.267 2.574 2.282 2.114 2.004 1.924 1.864 1.816 1.777 1.744 1.717 1.693 1.672 1.653 1.637 1.622 1.608 1.597 1.585 1.575 1.566 1.557 1.548 1.541 0 0 0 0 0.030 0.118 0.185 0.239 0.284 0.321 0.354 0.382 0.406 0.428 0.448 0.466 0.482 0.497 0.510 0.523 0.534 0.545 0.555 0.565 3.267 2.568 2.266 2.089 1.970 1.882 1.815 1.761 1.716 1.679 1.646 1.618 1.594 1.572 1.552 1.534 1.518 1.503 1.490 1.477 1.466 1.455 1.445 1.435Step by Step Solution
There are 3 Steps involved in it
1 Expert Approved Answer
Step: 1 Unlock

Question Has Been Solved by an Expert!
Get step-by-step solutions from verified subject matter experts
Step: 2 Unlock
Step: 3 Unlock