

Question: Please using R language to finish. 3.2 Added-variable plots (Data file: UN11) This problem uses the United Nations example in Section 3.1 to demonstrate many
Please using R language to finish.
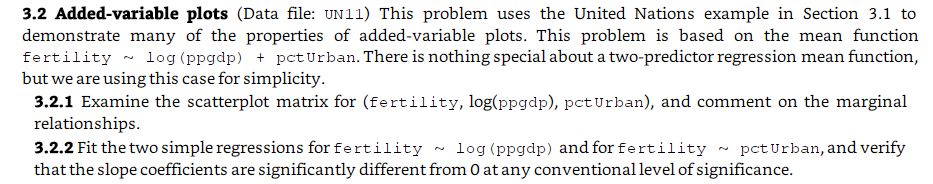
3.2 Added-variable plots (Data file: UN11) This problem uses the United Nations example in Section 3.1 to demonstrate many of the properties of added-variable plots. This problem is based on the mean function fertility og (ppgdp) pctUrban. There is nothing special about a two-predictor regression mean function but we are using this case for simplicity 3.2.1 Examine the scatterplot matrix for fertility, log(ppgdp), pct Urban), and comment on the marginal relationships 3.2.2 Fit the two simple regressions for fertility og (ppgdp) and for fertility pcturban, and verify that the slope coefficients are significantly different from 0 atany conventional level of significance. 3.2 Added-variable plots (Data file: UN11) This problem uses the United Nations example in Section 3.1 to demonstrate many of the properties of added-variable plots. This problem is based on the mean function fertility og (ppgdp) pctUrban. There is nothing special about a two-predictor regression mean function but we are using this case for simplicity 3.2.1 Examine the scatterplot matrix for fertility, log(ppgdp), pct Urban), and comment on the marginal relationships 3.2.2 Fit the two simple regressions for fertility og (ppgdp) and for fertility pcturban, and verify that the slope coefficients are significantly different from 0 atany conventional level of significance
Step by Step Solution
There are 3 Steps involved in it

Get step-by-step solutions from verified subject matter experts