

Question: please view both pictures the second one is the second half of the right data table Homework: HW4 Score: 0 of 3 pts 5 of
please view both pictures the second one is the second half of the right data table
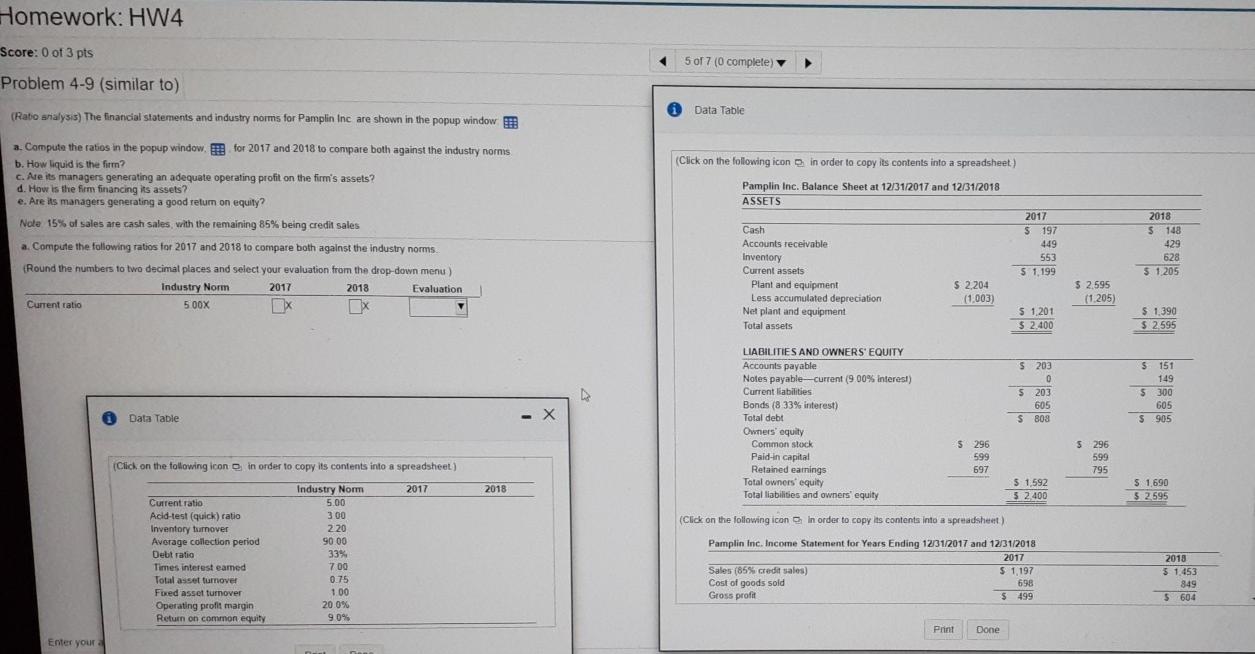
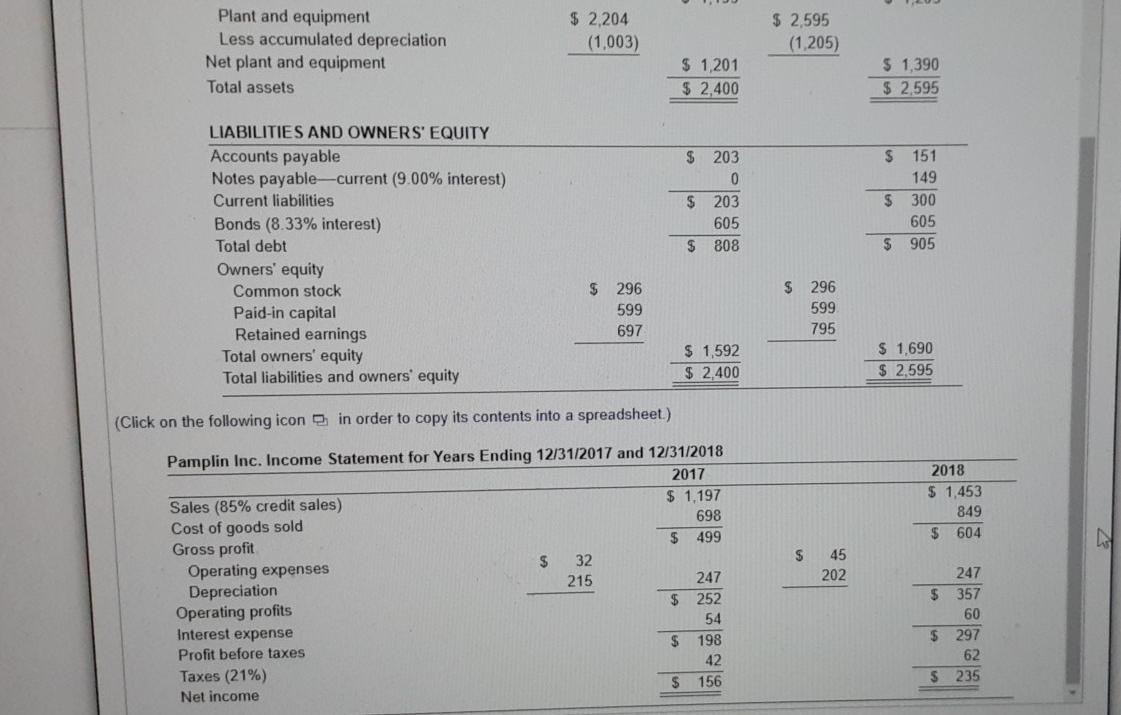
Homework: HW4 Score: 0 of 3 pts 5 of 7 (0 complete) Problem 4-9 (similar to) Data Table (Rato analysis) The financial statements and industry norms for Pamplin Inc are shown in the popup window (Click on the following icon in order to copy its contents into a spreadsheet) Pamplin Inc. Balance Sheet at 12/31/2017 and 12/31/2018 ASSETS a. Compute the ratios in the popup window for 2017 and 2018 to compare both against the industry norms b. How liquid is the fir? c. Are its managers generating an adequate operating profit on the firm's assets? d. How is the firm financing its assets? e. Are its managers generating a good relum on equily? Nole 15% of sales are cash sales, with the remaining 85% being credit sales a. Compute the following ratios for 2017 and 2018 to compare both against the industry norms. Round the numbers to two decimal places and select your evaluation from the drop-down menu) Industry Norm 2017 2018 Evaluation Current ratio 500X X 2017 S 197 449 553 5 1,199 2018 $ 148 429 628 $ 1.205 Cash Accounts receivable Inventory Current assets Plant and equipment Less accumulated depreciation Net plant and equipment Total assets $ 2,204 (1.003) $ 2.595 (1.205) $ 1,201 $ 2.400 $ $ 1.390 $ 2.595 $ 203 0 0 5 203 605 $ 808 $ 151 149 $ 300 605 $ 905 LIABILITIES AND OWNERS' EQUITY Accounts payable Notes payable--current (9.00% interest) 9 ) Current liabilities Bonds (8 33% interest) Total debt Owners' equity Common stock Paid-in capital Retained earnings Total owners' equity Total liabilities and owners' equity Data Table 5 296 599 697 5 296 599 795 (Click on the following icon in order to copy its contents into a spreadsheet) 2017 2018 $ 1,592 3.2.400 $ 1,690 $ 2.595 (Click on the following icon in order to copy its contents into a spreadsheet) Current ratio Acid-test (quick) ratio Inventory turnover Average collection period Debt ratio Times interest eamed Total asset turnover Fixed asset turnover Operating profit margin Return on common equity Industry Norm 5.00 300 220 90.00 33% 700 0.75 1 00 20 0% 90% Pamplin Inc. Income Statement for Years Ending 12/31/2017 and 12/31/2018 2017 Sales (65% credit sales) $ 1,197 Cost of goods sold 698 Gross profit $ 499 2018 5 1.453 849 $ 604 Print Done Enter your Plant and equipment Less accumulated depreciation Net plant and equipment Total assets $ 2,204 (1,003) $ 2,595 (1.205) $ 1,201 $ 2,400 $ 1,390 $ 2,595 $ 203 0 $ 203 605 $ 808 $ 151 149 $ 300 605 $ 905 LIABILITIES AND OWNERS' EQUITY Accounts payable Notes payablecurrent (9.00% interest) Current liabilities Bonds (8.33% interest) Total debt Owners' equity Common stock Paid-in capital Retained earnings Total owners' equity Total liabilities and owners' equity $ 296 599 697 $ 296 599 795 $ 1,592 $ 2,400 $ 1,690 $ 2,595 (Click on the following icon in order to copy its contents into a spreadsheet.) 2018 $ 1,453 849 $ 604 Pamplin Inc. Income Statement for Years Ending 12/31/2017 and 12/31/2018 2017 Sales (85% credit sales) $ 1.197 Cost of goods sold 698 Gross profit $ 499 $ Operating expenses 32 Depreciation 215 247 $ Operating profits 252 Interest expense 54 Profit before taxes $ 198 Taxes (21%) 42 Net income $ 156 ; $ 45 202 247 $ 357 60 $ 297 62 $ 235
Step by Step Solution
There are 3 Steps involved in it

Get step-by-step solutions from verified subject matter experts