

Question: * * * Please when filling out the graphs leave a chart with the points, sometimes graphs are hard to read, thanks! : ) *
Please when filling out the graphs leave a chart with the points, sometimes graphs are hard to read, thanks! :
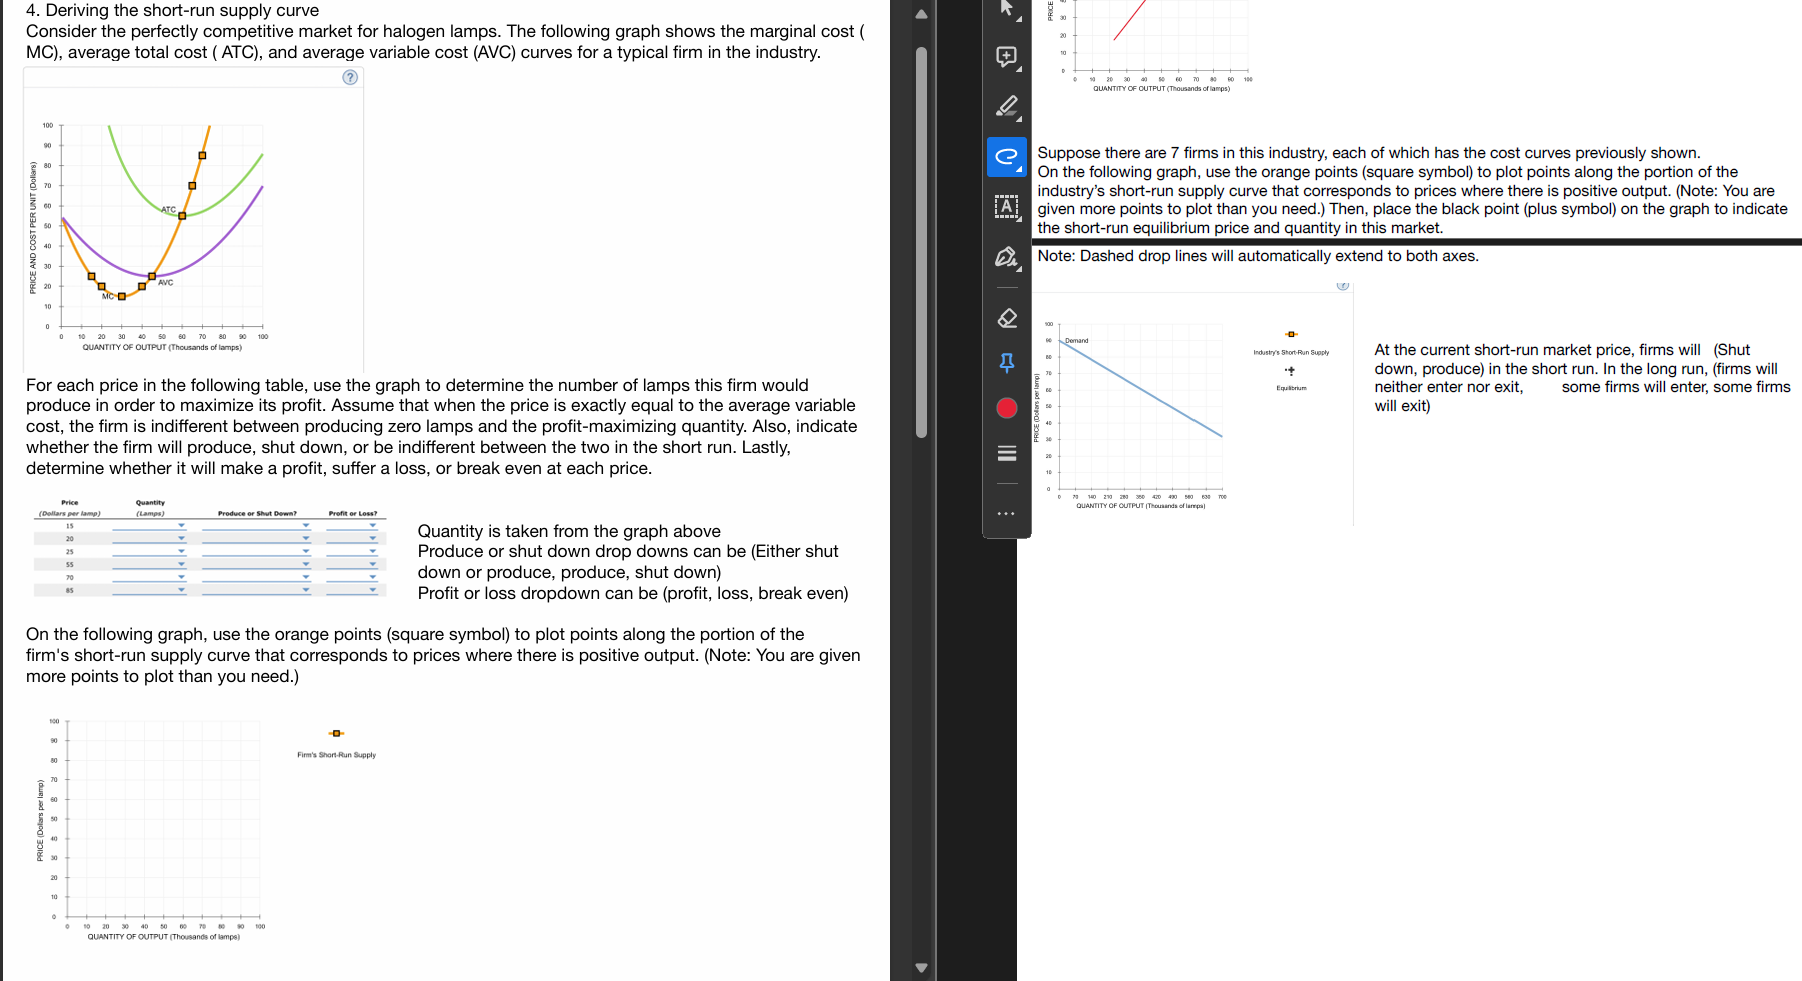
Suppose there are firms in this industry, each of which has the cost curves previously shown.
On the following graph, use the orange points square symbol to plot points along the portion of the
industry's shortrun supply curve that corresponds to prices where there is positive output. Note: You are
given more points to plot than you need. Then, place the black point plus symbol on the graph to indicate
the shortrun equilibrium price and quantity in this market.
Note: Dashed drop lines will automatically extend to both axes.
At the current shortrun market price, firms will Shut
down, produce in the short run. In the long run, firms will
neither enter nor exit, some firms will enter, some firms
will exit
Step by Step Solution
There are 3 Steps involved in it
1 Expert Approved Answer
Step: 1 Unlock

Question Has Been Solved by an Expert!
Get step-by-step solutions from verified subject matter experts
Step: 2 Unlock
Step: 3 Unlock