

Question: please whoever will be doing this make it clear so that I can read and see whatever will be there. Part C: it says write
please whoever will be doing this make it clear so that I can read and see whatever will be there.
Part C: it says write a business report by attaching A and B as appendices. business report should provide the assessment of strengths and weaknesses of this company and overall recommendation.
I need it in Two hours can someone please do it for me and clear so that I can see what is there.
This is the whole question to solve.
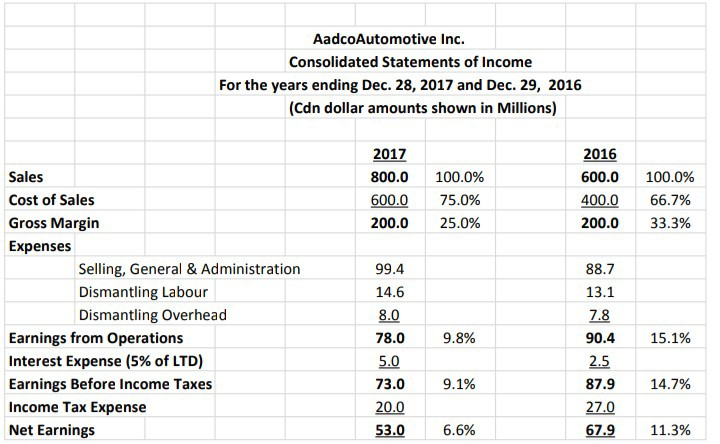
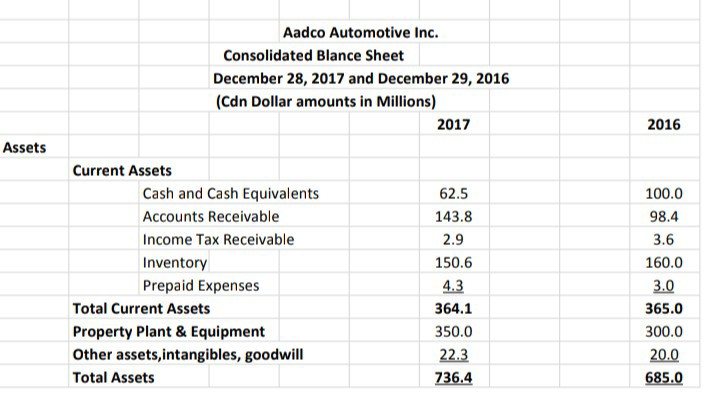
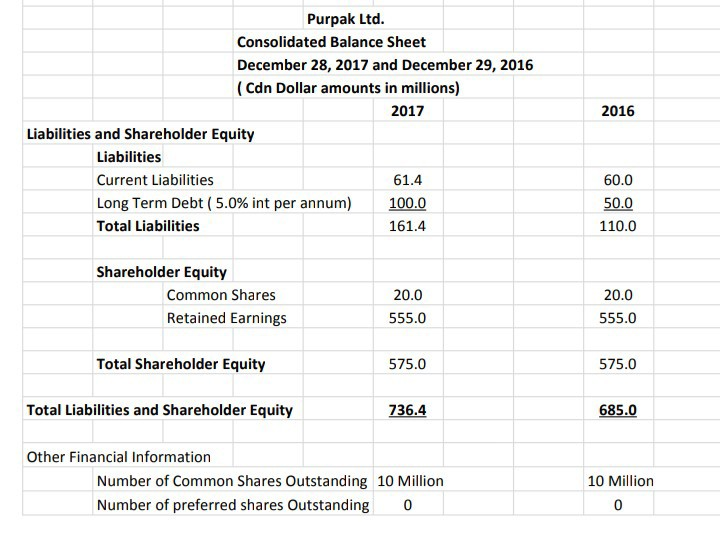
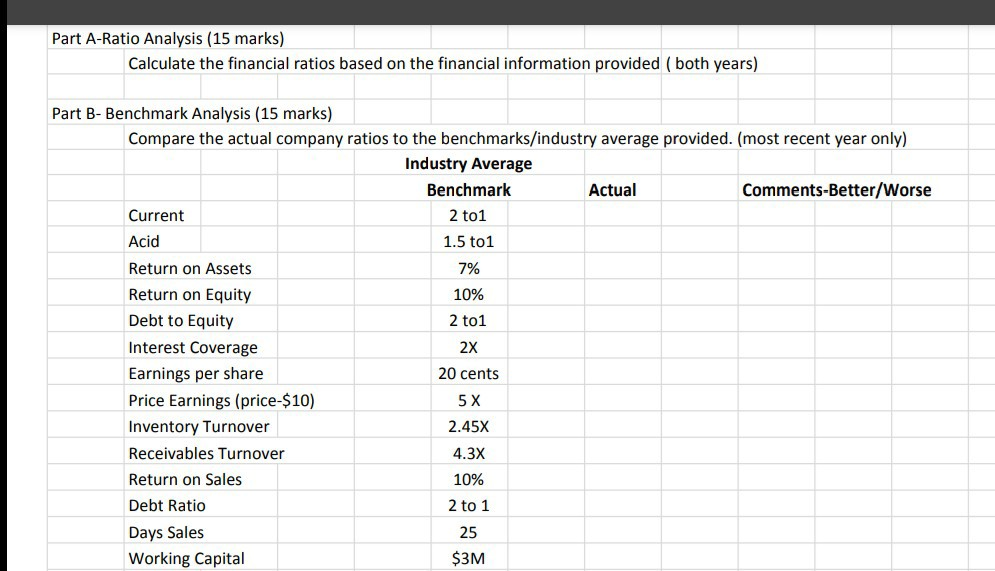
AadcoAutomotive Inc. Consolidated Statements of Income For the years ending Dec. 28, 2017 and Dec. 29, 2016 (Cdn dollar amounts shown in Millions) 2017 800.0 600.0 200.0 100.0% 75.0% 25.0% 2016 600.0 400.0 200.0 100.0% 66.7% 33.3% 88.7 13.1 Sales Cost of Sales Gross Margin Expenses Selling, General & Administration Dismantling Labour Dismantling Overhead Earnings from Operations Interest Expense (5% of LTD) Earnings Before Income Taxes Income Tax Expense Net Earnings 7.8 9.8% 15.1% 99.4 14.6 8.0 78.0 5.0 73.0 20.0 53.0 9.1% 90.4 2.5 87.9 27.0 67.9 14.7% 6.6% 11.3% Aadco Automotive Inc. Consolidated Blance Sheet December 28, 2017 and December 29, 2016 (Cdn Dollar amounts in Millions) 2017 2016 Assets 62.5 100.0 98.4 3.6 160.0 Current Assets Cash and Cash Equivalents Accounts Receivable Income Tax Receivable Inventory Prepaid Expenses Total Current Assets Property Plant & Equipment Other assets, intangibles, goodwill Total Assets 3.0 143.8 2.9 150.6 4.3 364.1 350.0 22.3 736.4 365.0 300.0 20.0 685.0 2016 Purpak Ltd. Consolidated Balance Sheet December 28, 2017 and December 29, 2016 (Cdn Dollar amounts in millions) 2017 Liabilities and Shareholder Equity Liabilities Current Liabilities 61.4 Long Term Debt (5.0% int per annum) 100.0 Total Liabilities 161.4 60.0 50.0 110.0 Shareholder Equity Common Shares Retained Earnings 20.0 555.0 20.0 555.0 Total Shareholder Equity 575.0 575.0 Total Liabilities and Shareholder Equity 736.4 685.0 Other Financial Information Number of Common Shares Outstanding 10 Million Number of preferred shares Outstanding 10 10 Million Part A-Ratio Analysis (15 marks) Calculate the financial ratios based on the financial information provided (both years) Part B- Benchmark Analysis (15 marks) Compare the actual company ratios to the benchmarks/industry average provided. (most recent year only) Industry Average Benchmark Actual Comments-Better/Worse Current 2 to1 Acid 1.5 to 1 Return on Assets 7% Return on Equity 10% Debt to Equity 2 to1 Interest Coverage 2x Earnings per share 20 cents Price Earnings (price $10) 5 X Inventory Turnover 2.45X Receivables Turnover 4.3X Return on Sales 10% Debt Ratio 2 to 1 Days Sales 25 Working Capital $3M AadcoAutomotive Inc. Consolidated Statements of Income For the years ending Dec. 28, 2017 and Dec. 29, 2016 (Cdn dollar amounts shown in Millions) 2017 800.0 600.0 200.0 100.0% 75.0% 25.0% 2016 600.0 400.0 200.0 100.0% 66.7% 33.3% 88.7 13.1 Sales Cost of Sales Gross Margin Expenses Selling, General & Administration Dismantling Labour Dismantling Overhead Earnings from Operations Interest Expense (5% of LTD) Earnings Before Income Taxes Income Tax Expense Net Earnings 7.8 9.8% 15.1% 99.4 14.6 8.0 78.0 5.0 73.0 20.0 53.0 9.1% 90.4 2.5 87.9 27.0 67.9 14.7% 6.6% 11.3% Aadco Automotive Inc. Consolidated Blance Sheet December 28, 2017 and December 29, 2016 (Cdn Dollar amounts in Millions) 2017 2016 Assets 62.5 100.0 98.4 3.6 160.0 Current Assets Cash and Cash Equivalents Accounts Receivable Income Tax Receivable Inventory Prepaid Expenses Total Current Assets Property Plant & Equipment Other assets, intangibles, goodwill Total Assets 3.0 143.8 2.9 150.6 4.3 364.1 350.0 22.3 736.4 365.0 300.0 20.0 685.0 2016 Purpak Ltd. Consolidated Balance Sheet December 28, 2017 and December 29, 2016 (Cdn Dollar amounts in millions) 2017 Liabilities and Shareholder Equity Liabilities Current Liabilities 61.4 Long Term Debt (5.0% int per annum) 100.0 Total Liabilities 161.4 60.0 50.0 110.0 Shareholder Equity Common Shares Retained Earnings 20.0 555.0 20.0 555.0 Total Shareholder Equity 575.0 575.0 Total Liabilities and Shareholder Equity 736.4 685.0 Other Financial Information Number of Common Shares Outstanding 10 Million Number of preferred shares Outstanding 10 10 Million Part A-Ratio Analysis (15 marks) Calculate the financial ratios based on the financial information provided (both years) Part B- Benchmark Analysis (15 marks) Compare the actual company ratios to the benchmarks/industry average provided. (most recent year only) Industry Average Benchmark Actual Comments-Better/Worse Current 2 to1 Acid 1.5 to 1 Return on Assets 7% Return on Equity 10% Debt to Equity 2 to1 Interest Coverage 2x Earnings per share 20 cents Price Earnings (price $10) 5 X Inventory Turnover 2.45X Receivables Turnover 4.3X Return on Sales 10% Debt Ratio 2 to 1 Days Sales 25 Working Capital $3M
Step by Step Solution
There are 3 Steps involved in it

Get step-by-step solutions from verified subject matter experts