

Question: please within 30 min University A process (Process #170) is under study to be controlled using control limits and X and R charts. A process
please within 30 min
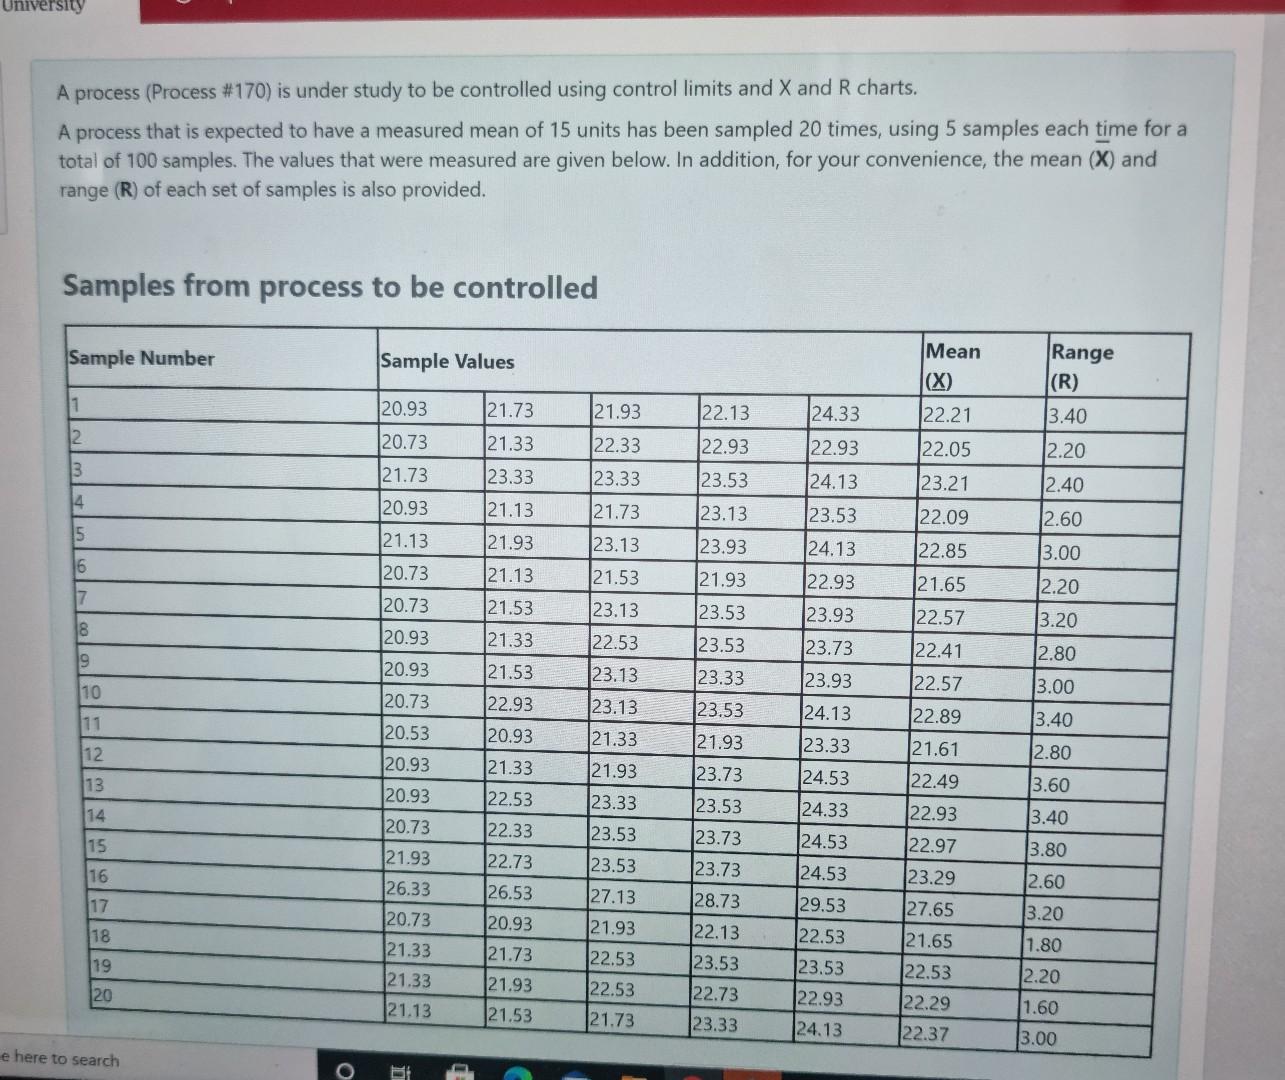
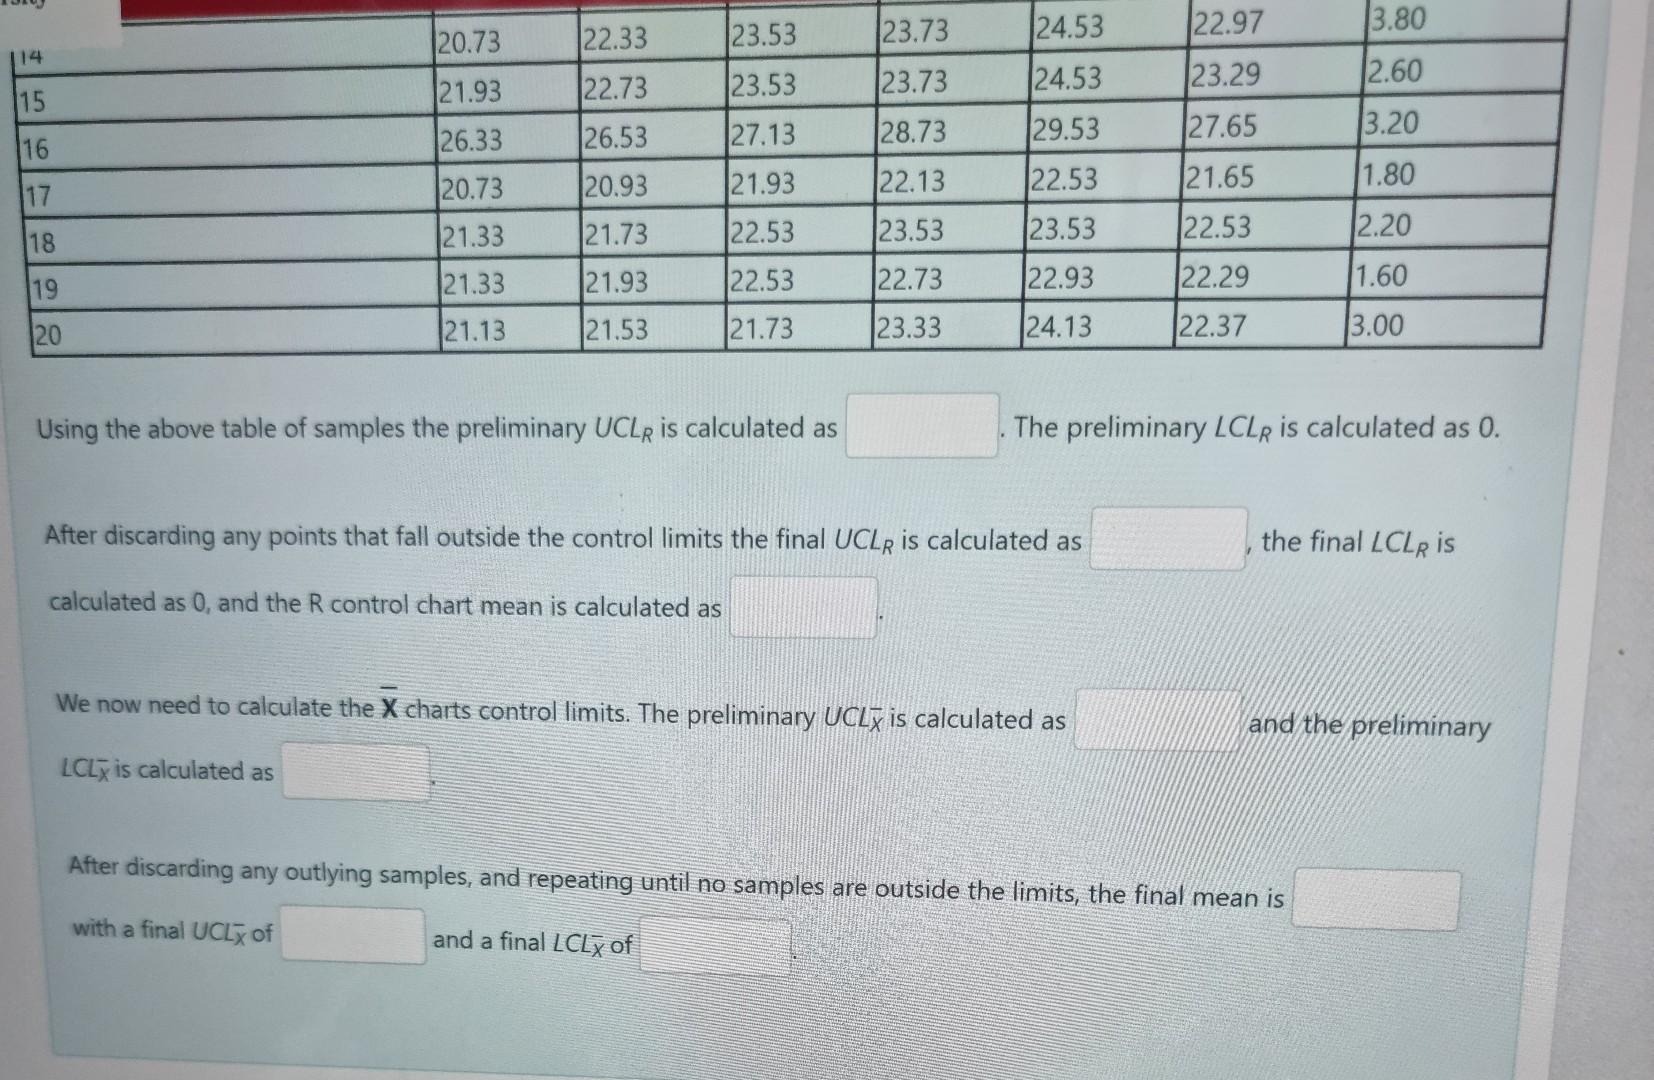
University A process (Process #170) is under study to be controlled using control limits and X and R charts. A process that is expected to have a measured mean of 15 units has been sampled 20 times, using 5 samples each time for a total of 100 samples. The values that were measured are given below. In addition, for your convenience, the mean (X) and range (R) of each set of samples is also provided. Samples from process to be controlled Sample Number Sample Values Mean (X) 22.21 Range (R) 3.40 1 20.93 21.73 21.93 22.13 24.33 2 20.73 22.93 22.93 12.20 13 21.33 23.33 21.13 22.33 23.33 21.73 23.53 24.13 14 22.05 23.21 22.09 22.85 2.40 2.60 23.53 15 123.13 23.93 21.93 24.13 21.73 23.13 21.53 23.13 3.00 16 21.13 21.93 22.93 21.65 2.20 17 21.53 23.93 22.57 18 23.53 23.53 21.33 22.53 23.73 22.41 3.20 2.80 13.00 23.13 23.33 21.53 22.93 23.93 23.53 19 10 11 12 13 23.13 21.33 24.13 3.40 20.93 21.93 23.33 20.93 21.13 20.73 20.73 20.93 120.93 20.73 20.53 20.93 20.93 20.73 21.93 26.33 20.73 21.33 21.33 21.13 2.80 21.33 21.93 22.57 22.89 121.61 122.49 22.93 22.97 23.73 24.53 23.33 23.53 14 22.53 22.33 24.33 23.53 15 24.53 22.73 23.73 23.73 16 26.53 23.29 27.65 28.73 17 3.60 3.40 3.80 2.60 3.20 1.80 2.20 1.60 20.93 23.53 27.13 (21.93 22.53 22.53 21.73 18 24.53 29.53 22.53 23.53 22.93 21.65 19 22.13 23.53 22.73 23.33 21.73 21.93 22.53 20 22.29 21.53 124.13 22.37 3.00 e here to search o 20.73 122.33 23.53 123.73 122.97 13.80 124.53 (22.73 123.53 121.93 23.73 24.53 123.29 12.60 15 127.13 26.53 28.73 129.53 127.65 3.20 116 26.33 20.73 20.93 21.93 17 122.13 122.53 21.65 (1.80 121.33 21.73 22.53 123.53 18 23.53 122.53 12.20 21.33 21.93 19 22.73 122.93 122.29 1.60 122.53 21.73 20 21.13 21.53 23.33 24.13 122.37 13.00 Using the above table of samples the preliminary UCLR is calculated as The preliminary LCLR is calculated as 0. After discarding any points that fall outside the control limits the final UCLR is calculated as the final LCLR is calculated as 0, and the R control chart mean is calculated as We now need to calculate the X charts control limits. The preliminary UCLx is calculated as and the preliminary LCLX is calculated as After discarding any outlying samples, and repeating until no samples are outside the limits, the final mean is with a final UCLX of and a final LCCg ofStep by Step Solution
There are 3 Steps involved in it
1 Expert Approved Answer
Step: 1 Unlock

Question Has Been Solved by an Expert!
Get step-by-step solutions from verified subject matter experts
Step: 2 Unlock
Step: 3 Unlock