

Question: please work this out on excel with step by step instructions. if you can please include photos for examples The following data is the weight
please work this out on excel with step by step instructions. if you can please include photos for examples 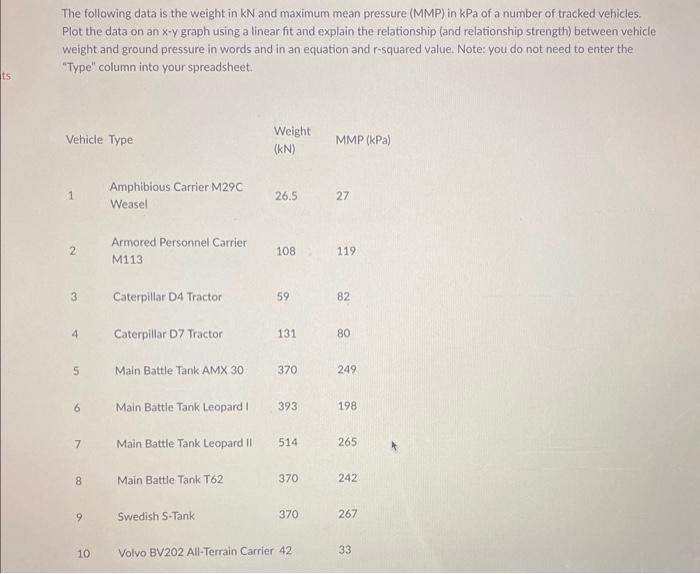
The following data is the weight in kN and maximum mean pressure (MMP) in kPa of a number of tracked vehicles. Plot the data on an x-y graph using a linear fit and explain the relationship (and relationship strength) between vehicle weight and ground pressure in words and in an equation and r-squared value. Note: you do not need to enter the "Type" column into your spreadsheet
Step by Step Solution
There are 3 Steps involved in it
1 Expert Approved Answer
Step: 1 Unlock

Question Has Been Solved by an Expert!
Get step-by-step solutions from verified subject matter experts
Step: 2 Unlock
Step: 3 Unlock