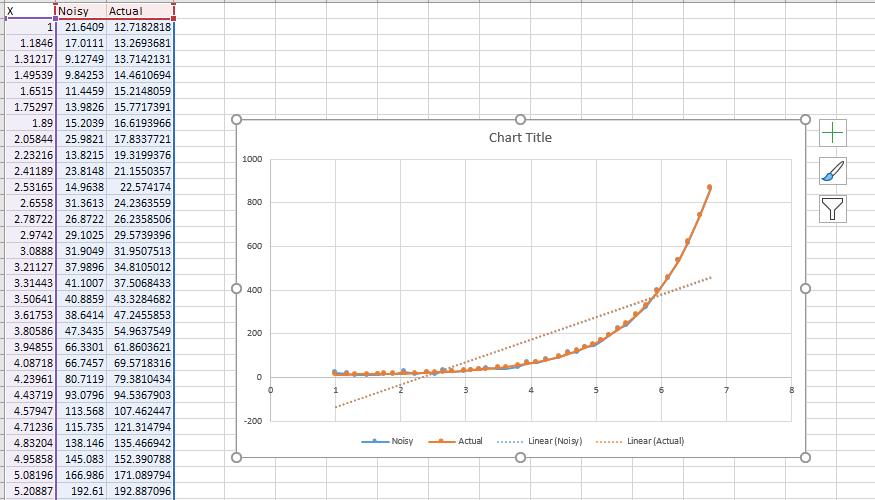
Please write a comment on the fit of the curve please solve this in 1 hour INoisy
Fantastic news! We've Found the answer you've been seeking!
Question:
Please write a comment on the fit of the curve
please solve this in 1 hour
Transcribed Image Text:
INoisy 1] 21.6409 12.7182818 1.1846 17.0111 13.2693681 1.31217 9.12749 13.7142131 1.49539 9.84253 14.4610694 1.6515 11.4459 15.2148059 1.75297 13.9826 15.7717391 15.2039 16.6193966 2.05844 25.9821 17.8337721 2.23216 13.8215 19.3199376 2.41189 23.8148 21.1550357 2.53165 14.9638 2.6558 31.3613 24.2363559 2.78722 26.8722 26.2358506 2.9742 29.1025 29.5739396 3.0888 31.9049 31.9507513 3.21127 37.9896 34.8105012 3.31443 41.1007 37.5068433 3.50641 40.8859 43.3284682 3.61753 38.6414 47.2455853 3.80586 47.3435 54.9637549 3.94855 66.3301 61.8603621 4.08718 66.7457 69.5718316 4.23961 80.7119 79.3810434 4.43719 93.0796 94.5367903 4.57947 113.568 107.462447 4.71236 115.735 121.314794 4.83204 138.146 135.466942 4.95858 145.083 152.390788 5.08196 166.986 171.089794 192.61 192.887096 Actual 1.89 Chart Title 1000 22.574174 800 600 O 400 200 -200 Noisy Actual Linear (Noisy) Linear (Actual) 5.20887 田N INoisy 1] 21.6409 12.7182818 1.1846 17.0111 13.2693681 1.31217 9.12749 13.7142131 1.49539 9.84253 14.4610694 1.6515 11.4459 15.2148059 1.75297 13.9826 15.7717391 15.2039 16.6193966 2.05844 25.9821 17.8337721 2.23216 13.8215 19.3199376 2.41189 23.8148 21.1550357 2.53165 14.9638 2.6558 31.3613 24.2363559 2.78722 26.8722 26.2358506 2.9742 29.1025 29.5739396 3.0888 31.9049 31.9507513 3.21127 37.9896 34.8105012 3.31443 41.1007 37.5068433 3.50641 40.8859 43.3284682 3.61753 38.6414 47.2455853 3.80586 47.3435 54.9637549 3.94855 66.3301 61.8603621 4.08718 66.7457 69.5718316 4.23961 80.7119 79.3810434 4.43719 93.0796 94.5367903 4.57947 113.568 107.462447 4.71236 115.735 121.314794 4.83204 138.146 135.466942 4.95858 145.083 152.390788 5.08196 166.986 171.089794 192.61 192.887096 Actual 1.89 Chart Title 1000 22.574174 800 600 O 400 200 -200 Noisy Actual Linear (Noisy) Linear (Actual) 5.20887 田N
Expert Answer:
Answer rating: 100% (QA)
First Plot The curve has been plotted for the two output variables named Noisy and Actual for the input function named X The both data sets ie the noi... View the full answer
Related Book For
Posted Date:
Students also viewed these mathematics questions
-
Write a comment on the following statement: Saving is no longer necessary in a modern technological advanced economy, where advanced financial institutions can create instant credit in the billions...
-
Write a comment on each of the following question as to whether or not it is a good question. If it is not, explain why. 1. Do you read National Geographic magazine regularly? 2. What percentage of...
-
Suppose girls and boys are born equally often. A family has four chil- dren. At least two of the children are girls. What is the probability that all four children are girls?
-
A company has the following data: net sales, $405,000; cost of goods sold, $220,000; selling expenses, $90,000; general and administrative expenses, $60,000; interest expense, $4,000; and interest...
-
A new 1.5-volt battery has an actual voltage that is uniformly distributed between 1.43 and 1.60 volts. Estimate the probability that the sum of the voltages from 120 new batteries lies between 180...
-
In a textile manufacturing plant, the waste dyeing water (c p = 4295 J/kg·K) at 75°C is to be used to preheat fresh water (c p = 4180 J/kg·K) at 15°C at the same flow rate in a...
-
Go to the St. Louis Federal Reserve FRED database, and find data on real GDP (GDPC1), potential GDP (GDPPOT), and the unemployment rate (UNRATE) from 1960 to the most recent period. For the...
-
Seagren Industries Inc. manufactures in separate processes furniture for homes. In each process, materials are entered at the beginning, and conversion costs are incurred uniformly. Production and...
-
2. There are two kinds of people, who are those with college degrees and those without college degrees. Assume that they are all white-collar workers. The wage status is described in Table 1. Table...
-
The case study shown below provides an overview of Road Transit Systems (RTS) - a specialist preventative vehicle maintenance program operator in NSW, Australia. A number of attributes have been...
-
Which of the following represents a source of short-term funding? Common stock Corporate bonds Commercial paper Retained earnings
-
A City Council requires the ability to deploy an Employee Management Solution to all business areas across the organisation. They are required to develop a Recruitment Management System (RMS) and...
-
A brief description of Scope creep in Project Management and challenges you chose to help the reader understand what you are talking about (assume the readers do not understand the topic). Why did...
-
What career can be chosen using this major and your career goals, including how speech communications will be a part of your future goals, 3 - 4 minutes. Write your introduction for the symposium,...
-
How do I fix this code so that display all customers includes new added customers and fix the error so that it can search a five number customer ID without error import java.util.Scanner; public...
-
Q. Convert the following code to UMSL assembly language and run with virutal machine. Run this code on input 50, 48, 52, -10 and 0. int main() { int age: printf("Please enter your age"); scanf("%d",...
-
Suppose A=1 1 1 8. Matrix multiplication 1 1 2 3 B -1 -2 4 , find A+2B. 0 5 1 0 -1 2 3 20 2 2 . (10 points) 23 1 3 1 3
-
Suppose the spot and six-month forward rates on the Norwegian krone are Kr 5.78 and Kr 5.86, respectively. The annual risk-free rate in the United States is 3.8 percent, and the annual risk-free rate...
-
One method of slowing the growth of an insect population without using pesticides is to introduce into the population a number of sterile males that mate with fertile females but produce no...
-
Find equations of the tangent line and normal line to the given curve at the specified point. y = 2xex, (0, 0)
-
If 4x - 9 f(x) x2 - 4X + 7 for x 0, find f(x). lim
-
Using quarterly data since 1960, graph the following four series, expressing each as a percent of GDP: exports of goods (sometimes called merchandise), exports of services, imports of goods...
-
This problem asks you to calculate the actual (as opposed to the expected) real after-tax interest rate using annual data from 1961 to the present. The formula for the actual real after-tax interest...
-
Using quarterly data since 1960, graph output and absorption (both in real terms) in the same figure. In another figure, graph real investment, national saving, and the current account balance for...
Study smarter with the SolutionInn App