

Question: Please write a detailed post responding to this question. Question: Examine if PepsiCo's business portfolio exhibits a good strategic fit. Then identify visible value-chain match-ups,
Please write a detailed post responding to this question.
Question: Examine if PepsiCo's business portfolio exhibits a good strategic fit. Then identify visible value-chain match-ups, skills transfer, cost-sharing, or brand-sharing opportunities.
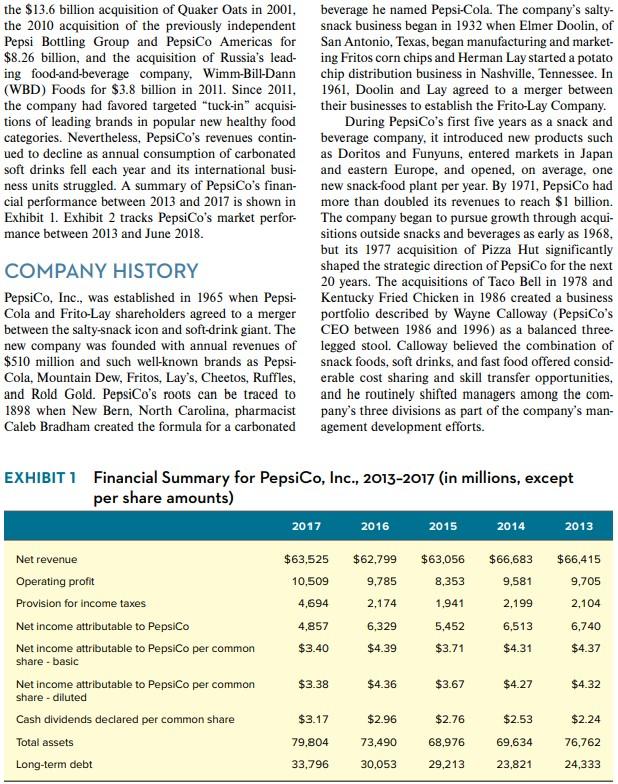
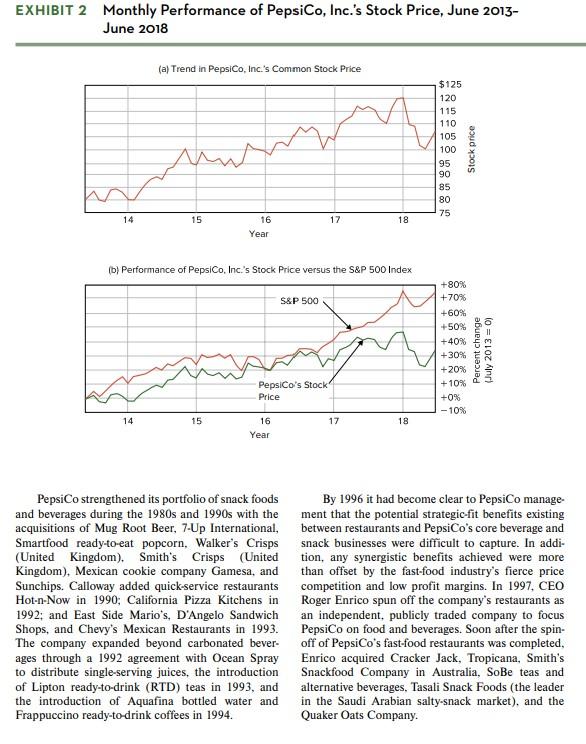
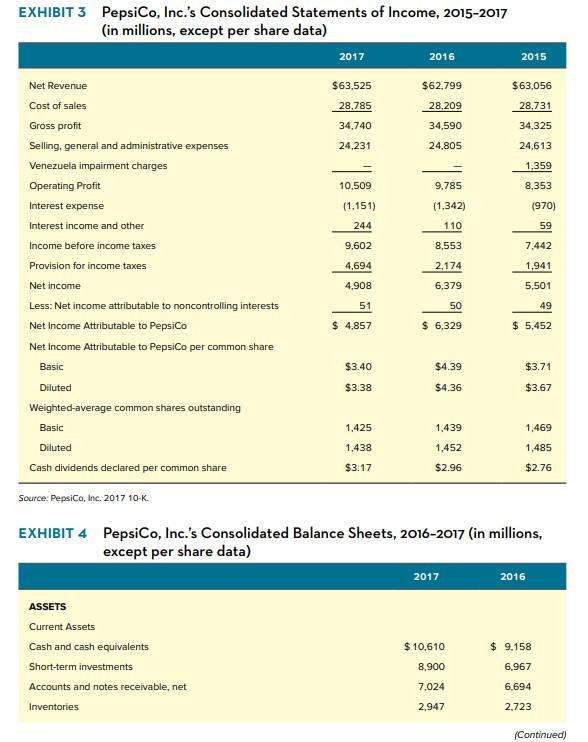
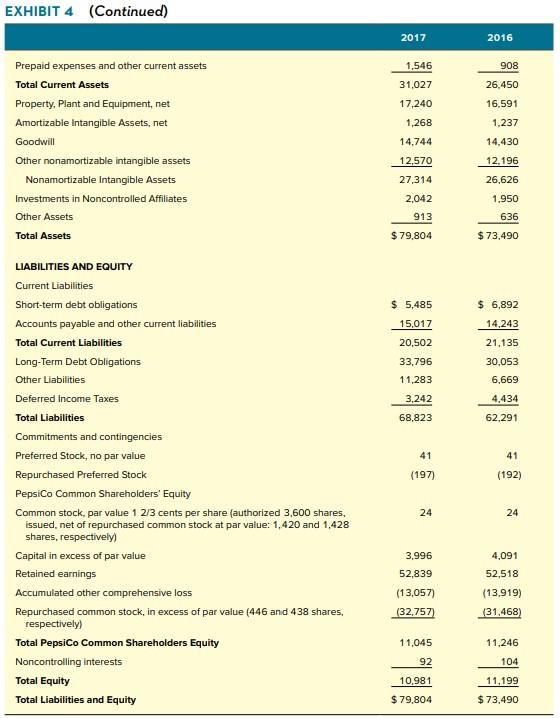
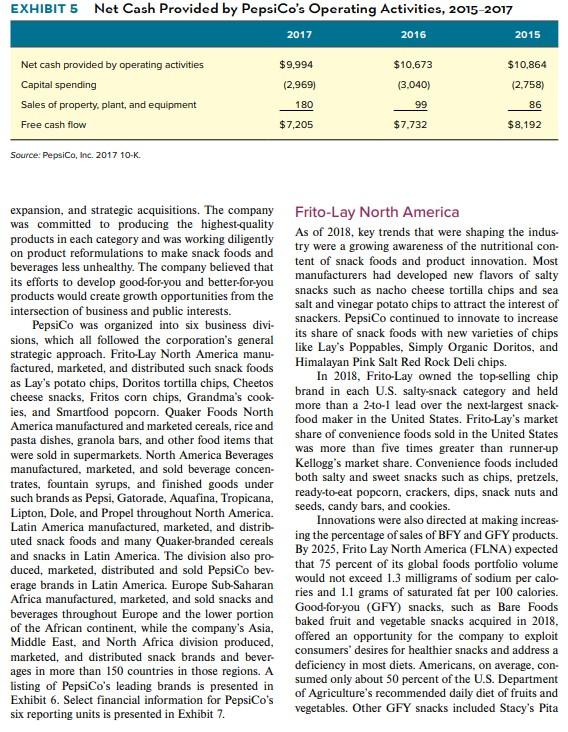
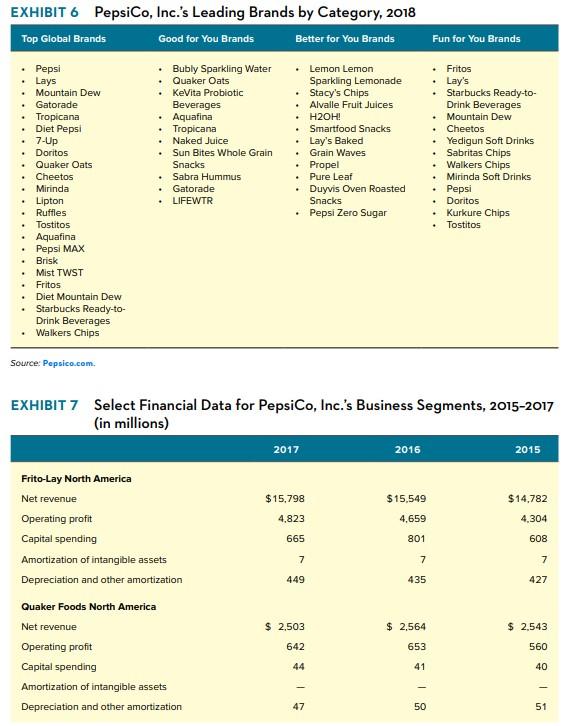
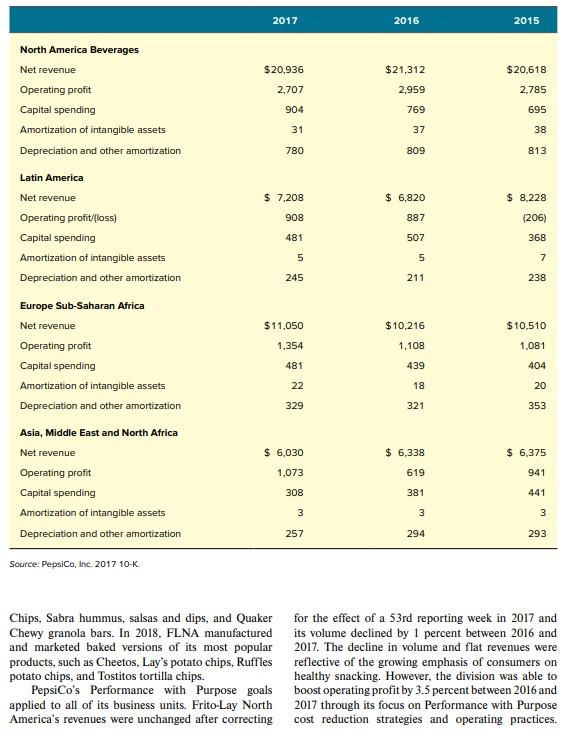
epsiCo was the world's largest snack and bever- In addition to focusing on strategies designed to age company, with 2017 net revenues of approxi- deliver revenue and earnings growth, the company mately $63.5 billion. The company's portfolio maintained an aggressive share repurchase and diviof businesses in 2018 included Frito-Lay salty snacks, dend policy, with a planned $7 billion returned to Quaker Chewy granola bars, Pepsi soft-drink products, shareholders in 2018 through share repurchases of Tropicana orange juice, Lipton Brisk tea, Gatorade, $2 billion and dividends of approximately $5 billion. Propel, Bubly, Quaker Oatmeal, Cap'n Crunch, The company bolstered its cash returns through careAquafina, Rice-A-Roni, Aunt Jemima pancake mix, fully considered capital expenditures and acquisitions and many other regularly consumed products. The and a focus on operational excellence. Its Performance company viewed the lineup as highly complemen- with Purpose plan utilized investments in manufacturtary since most of its products could be consumed ing automation, a rationalized global manufacturing together. For example, Tropicana orange juice might plan, and reengineered distribution systems to drive be consumed during breakfast with Quaker Oatmeal, efficiency. In addition, the company's Performance Stacy's pita chips and Sabra hummus might make a with Purpose plan was focused on minimizing the nice snack, and Doritos and a Mountain Dew might company's impact on the environment by lowering be part of someone's lunch. In 2018, PepsiCo's busi- energy and water consumption and reducing its use ness lineup included 22$1 billion global brands. of packaging material, providing a safe and inclusive The company's top managers were focused on workplace for employees, and supporting and investsustaining the impressive performance through strat- ing in the local communities in which it operated. For egies keyed to product innovation, close relationships example, PepsiCo had expanded access to safe water with distribution allies, international expansion, to nearly 16 million people in water-stressed parts and strategic acquisitions. Newly introduced prod- of the world between 2006 and 2018. In addition, ucts such as Bubly sparkling water, Mountain Dew Performance with Purpose planned to reduce average Ice, Doritos Blaze tortilla chips, Sweet Potato Sun sugars, saturated fat, and sodium in its food and beverChips, LIFEWTR functional waters, Lemon Lemon age portfolio each year through 2025 and saved more sparkling lemonade, and the 1893 premium line of than $600 million in operating expenses by 2016 . flavored colas accounted for 15 to 20 percent of all Even though the company had recorded a new growth in recent years. New product innovations number of impressive achievements over the past that addressed consumer health and wellness con- decade, its growth had slowed since 2011. In fact, cerns were important contributors to the company's the spikes in the company's revenue growth since growth, with PepsiCo's better-for-you and good-for- 2000 had resulted from major acquisitions such as you products becoming focal points in the company's new product development initiatives. Copyright $2018 by John E. Gamble. All rights reserved. the $13.6 billion acquisition of Quaker Oats in 2001, beverage he named Pepsi-Cola. The company's saltythe 2010 acquisition of the previously independent snack business began in 1932 when Elmer Doolin, of Pepsi Bottling Group and PepsiCo Americas for San Antonio, Texas, began manufacturing and market$8.26 billion, and the acquisition of Russia's lead- ing Fritos corn chips and Herman Lay started a potato ing food-and-beverage company, Wimm-Bill-Dann chip distribution business in Nashville, Tennessee. In (WBD) Foods for $3.8 billion in 2011. Since 2011, 1961, Doolin and Lay agreed to a merger between the company had favored targeted "tuck-in" acquisi- their businesses to establish the Frito-Lay Company. tions of leading brands in popular new healthy food During PepsiCo's first five years as a snack and categories. Nevertheless, PepsiCo's revenues contin- beverage company, it introduced new products such ued to decline as annual consumption of carbonated as Doritos and Funyuns, entered markets in Japan soft drinks fell each year and its international busi- and eastern Europe, and opened, on average, one ness units struggled. A summary of PepsiCo's finan- new snack-food plant per year. By 1971, PepsiCo had cial performance between 2013 and 2017 is shown in more than doubled its revenues to reach $1 billion. Exhibit 1. Exhibit 2 tracks PepsiCo's market perfor- The company began to pursue growth through acquimance between 2013 and June 2018. sitions outside snacks and beverages as early as 1968 , but its 1977 acquisition of Pizza Hut significantly COMPANY HISTORY Shaped the strategic direction of PepsiCo for the next Kentucky Fried Chicken in 1986 created a business Cola and Frito-Lay shareholders agreed to a merger portfolio described by Wayne Calloway (PepsiCo's between the salty-snack icon and soft-drink giant. The CEO between 1986 and 1996) as a balanced threenew company was founded with annual revenues of legged stool. Calloway believed the combination of $510 million and such well-known brands as Pepsi- snack foods, soft drinks, and fast food offered considCola, Mountain Dew, Fritos, Lay's, Cheetos, Ruffles, erable cost sharing and skill transfer opportunities, and Rold Gold. PepsiCo's roots can be traced to and he routinely shifted managers among the com1898 when New Bern, North Carolina, pharmacist pany's three divisions as part of the company's manCaleb Bradham created the formula for a carbonated agement development efforts. EXHIBIT 1 Financial Summary for PepsiCo, Inc., 2013-2017 (in millions, except per share amounts) EXHIBIT 2 Monthly Performance of PepsiCo, Inc.'s Stock Price, June 2013June 2018 (a) Trend in PepsiCo, Inc.'s Common Stock Price (b) Performance of PepsiCo, Inc.'s Stock Price versus the S\&P 500 Index PepsiCo strengthened its portfolio of snack foods By 1996 it had become clear to PepsiCo manageand beverages during the 1980 s and 1990 s with the ment that the potential strategic-fit benefits existing acquisitions of Mug Root Beer, 7-Up International, between restaurants and PepsiCo's core beverage and Smartfood ready-to-eat popcorn, Walker's Crisps snack businesses were difficult to capture. In addi(United Kingdom), Smith's Crisps (United tion, any synergistic benefits achieved were more Kingdom), Mexican cookie company Gamesa, and than offset by the fast-food industry's fierce price Sunchips. Calloway added quick-service restaurants competition and low profit margins. In 1997, CEO Hot-n-Now in 1990; California Pizza Kitchens in Roger Enrico spun off the company's restaurants as 1992; and East Side Mario's, D'Angelo Sandwich an independent, publicly traded company to focus Shops, and Chevy's Mexican Restaurants in 1993. PepsiCo on food and beverages. Soon after the spinThe company expanded beyond carbonated bever- off of PepsiCo's fast-food restaurants was completed, ages through a 1992 agreement with Ocean Spray Enrico acquired Cracker Jack, Tropicana, Smith's to distribute single-serving juices, the introduction Snackfood Company in Australia, SoBe teas and of Lipton ready-to-drink (RTD) teas in 1993, and alternative beverages, Tasali Snack Foods (the leader the introduction of Aquafina bottled water and in the Saudi Arabian salty-snack market), and the Frappuccino ready-to-drink coffees in 1994. Quaker Oats Company. PepsiCo's Better for You and Russian beverage producer Lebedyansky in 2008 for Good for You Acquisitions $1.8 billion, and in 2010 it acquired Marbo, a potato PepsiCo's $13.9 billion acquisition of Quaker Oats chip production operation in Serbia. in 2001 was the company's largest ever acquisition In 2010 and 2011, the company executed its larg. and gave it the number-one brand of oatmeal in the share; the leading brand of rice cakes and granola pendent Pepsi Bottling Group and PepsiCo Americas snack bars; and other well-known grocery brands grate its global distribution system for its beverage Gatorade was developed by and beverage company, Wimm-Bill-Dann Foods, for Florida researchers in 1965 , but it was not marketed Van Camp in 1967. When Quaker Bacquired the business allowed the company's revenues to increase from approximately $29 billion in 2004 to more than gradually made a transformation from a regionally PepsiCo made small "tuck-in" acquisitions totaldistributed product with annual sales of $90 million ing less than $500 million annually after its acquito a $2 billion powerhouse. Gatorade was able to sition of Wimm-Bill-Dann Foods. The company's increase sales by more than 10 percent annually dur- $200 million acquisition of sparkling probiotic bevering the 1990 s, with no new entrant to the sports bev- age brand, Kevita, in 2016 and its 2018 acquisition of erage category posing a serious threat to the brand's Bare Foods for an undisclosed amount were its most dominance. PepsiCo, Coca-Cola, France's Danone noteworthy acquisitions made after 2010. Both acquiGroup, and Swiss food giant Nestle all were attracted sitions were intended to expand its lineup of lower calto Gatorade because of its commanding market share orie and lower sodium "Guilt-Free Products." Global and because of the expected growth in the isotonic sales of health foods were estimated at $1 trillion in sports beverage category. 2017. The sales of Better for You (BFY) and Good for You (GFY) brands accounted for approximately PepsiCo's Focus on "Tuck-In" 50 percent of PepsiCo's annual sales in that year. Acquisitions (2002 to 2018) Exhibit 3 presents PepsiCo's consolidated statements After the completion of the Quaker Oats acquisition in Of income for 2015 to 2017, while the company's 2001 , the company focused on integration of Quaker Exhibit 4. The company's calculation of free cash PepsiCo portfolio. The company made a number of "tuck-in" acquisitions of small, fast-growing food and beverage companies in the United States and inter- PEPSICO'S BUSINESS UNIT nationally to broaden its portfolio of brands. Tuck-in acquisitions in 2006 included Stacey's bagel and pita chips, Izze carbonated beverages, Netherlands-based PepsiCo's corporate strategy had diversified the comDuyvis nuts, and Star Foods (Poland). Acquisitions pany into salty and sweet snacks, soft drinks, orange made during 2007 included Naked Juice fruit bever- juice, bottled water, ready-to-drink teas and coffees, ages, Sandora juices in the Ukraine, New Zealand's purified and functional waters, isotonic beverages, Bluebird snacks, Penelopa nuts and seeds in Bulgaria, hot and ready-to-eat breakfast cereals, grain-based and Brazilian snack producer Lucky. The company products, and breakfast condiments. Most PepsiCo also entered into a joint venture with the Strauss brands had achieved number-one or number-two posiGroup in 2007 to market Sabra-the top-selling and tions in their respective food and beverage categories fastestgrowing brand of hummus in the United through strategies keyed to product innovation, close States and Canada. The company acquired the relationships with distribution allies, international EXHIBIT 3 PepsiCo, Inc.'s Consolidated Statements of Income, 2015-2017 (in millions, except per share data) Source: PepsiCo, inc. 201710K. EXHIBIT 4 PepsiCo, Inc.'s Consolidated Balance Sheets, 2016-2017 (in millions, except per share data) EXHIBIT 4 (Continued) Prepaid expenses and other current assets Total Current Assets Property, Plant and Equipment, net Amortizable Intangible Assets, net Goodwill Other nonamortizable intangible assets Nonamortizable Intangible Assets Investments in Noncontrolled Affiliates Other Assets Total Assets \begin{tabular}{rr} 1,546 & 908 \\ & 26,450 \\ 17,240 & 16,591 \\ 1,268 & 1,237 \\ 14,744 & 14,430 \\ 12,570 & 12,196 \\ \hline 27,314 & 26,626 \\ 2,042 & 1,950 \\ 913 & 636 \\ \hline$79,804 & $73,490 \end{tabular} LIABILITIES AND EQUITY Current Liabilities Short-term debt obligations Accounts payable and other current liabilities Total Current Liabilities Long-Term Debt Obligations Other Liabilities Deferred Income Taxes Total Liabilities \begin{tabular}{rr} $5,485 & $6,892 \\ 15,017 & 14,243 \\ \hline 20,502 & 21,135 \\ 33,796 & 30,053 \\ 11,283 & 6,669 \\ 3,242 & 4,434 \\ \hline 68,823 & 62,291 \end{tabular} Commitments and contingencies Preferred Stock, no par value Repurchased Preferred Stock (197) (192) PepsiCo Common Shareholders' Equity Common stock, par value 12/3 cents per share (authorized 3,600 shares, 24 24 issued, net of repurchased common stock at par value: 1,420 and 1,428 shares, respectively) Capital in excess of par value Retained earnings Accumulated other comprehensive loss Repurchased common stock, in excess of par value ( 446 and 438 shares, respectively) Total PepsiCo Common Shareholders Equity Noncontrolling interests Total Equity Total Liabilities and Equity Source: PepsiCo, Inc. 201710K expansion, and strategic acquisitions. The company Frito-Lay North America was committed to producing the highest-quality products in each category and was working diligently As of 2018 , key trends that were shaping the induson product reformulations to make snack foods and try were a growing awareness of the nutritional conbeverages less unhealthy. The company believed that tent of snack foods and product innovation. Most its efforts to develop good-for-you and better-for-you manufacturers had developed new flavors of salty products would create growth opportunities from the snacks such as nacho cheese tortilla chips and sea intersection of business and public interests. salt and vinegar potato chips to attract the interest of PepsiCo was organized into six business divi- snackers. PepsiCo continued to innovate to increase sions, which all followed the corporation's general its share of snack foods with new varieties of chips strategic approach. Frito-Lay North America manu- like Lay's Poppables, Simply Organic Doritos, and factured, marketed, and distributed such snack foods Himalayan Pink Salt Red Rock Deli chips. as Lay's potato chips, Doritos tortilla chips, Cheetos In 2018, Frito-Lay owned the top-selling chip cheese snacks, Fritos corn chips, Grandma's cook- brand in each U.S. salty-snack category and held ies, and Smartfood popcorn. Quaker Foods North more than a 2-to-1 lead over the next-largest snackAmerica manufactured and marketed cereals, rice and food maker in the United States. Frito-Lay's market pasta dishes, granola bars, and other food items that share of convenience foods sold in the United States were sold in supermarkets. North America Beverages was more than five times greater than runner-up manufactured, marketed, and sold beverage concen- Kellogg's market share. Convenience foods included trates, fountain syrups, and finished goods under both salty and sweet snacks such as chips, pretzels. such brands as Pepsi, Gatorade, Aquafina, Tropicana, ready-to-eat popcorn, crackers, dips, snack nuts and Lipton, Dole, and Propel throughout North America. seeds, candy bars, and cookies. Latin America manufactured, marketed, and distrib-_ Innovations were also directed at making increasuted snack foods and many Quaker-branded cereals ing the percentage of sales of BFY and GFY products. and snacks in Latin America. The division also pro- By 2025, Frito Lay North America (FLNA) expected duced, marketed, distributed and sold PepsiCo bev- that 75 percent of its global foods portfolio volume erage brands in Latin America. Europe Sub-Saharan would not exceed 1.3 milligrams of sodium per caloAfrica manufactured, marketed, and sold snacks and ries and 1.1 grams of saturated fat per 100 calories. beverages throughout Europe and the lower portion Good-for-you (GFY) snacks, such as Bare Foods of the African continent, while the company's Asia, baked fruit and vegetable snacks acquired in 2018 , Middle East, and North Africa division produced, offered an opportunity for the company to exploit marketed, and distributed snack brands and bever- consumers' desires for healthier snacks and address a ages in more than 150 countries in those regions. A deficiency in most diets. Americans, on average, conlisting of PepsiCo's leading brands is presented in sumed only about 50 percent of the U.S. Department Exhibit 6. Select financial information for PepsiCo's of Agriculture's recommended daily diet of fruits and six reporting units is presented in Exhibit 7. vegetables. Other GFY snacks included Stacy's Pita EXHIBIT 6 PepsiCo, Inc.'s Leading Brands by Category, 2018 Source: Popsico.com. EXHIBIT 7 Select Financial Data for PepsiCo, Inc.'s Business Segments, 2015-2017 (in millions) Chips, Sabra hummus, salsas and dips, and Quaker for the effect of a 53rd reporting week in 2017 and Chewy granola bars. In 2018. FLNA manufactured its volume declined by 1 percent between 2016 and and marketed baked versions of its most popular 2017. The decline in volume and flat revenues were products, such as Cheetos, Lay's potato chips, Ruffles reflective of the growing emphasis of consumers on potato chips, and Tostitos tortilla chips. healthy snacking. However, the division was able to PepsiCo's Performance with Purpose goals boost operating profit by 3.5 percent between 2016 and applied to all of its business units. Frito-Lay North 2017 through its focus on Performance with Purpose America's revenues were unchanged after correcting cost reduction strategies and operating practices. The division produced 25 percent of PepsiCo's net rev- seller of juice and juice drinks globally; and NAB enues in 2017 and 46 percent of its operating profit. was the second-largest seller of carbonated soft drinks worldwide, with an approximate 27 percent Quaker Foods North America market share in 2017. Market leader Coca-Cola held Quaker Foods North American (QFNA) produced, approximately 42 percent share of the carbonated marketed, and distributed hot and ready-to-eat cere soft-drink (CSD) industry in 2017. Carbonated soft als, pancake mixes and syrups, and rice and pasta drinks were the most consumed type of beverage side dishes in the United States and Canada. The in the United States, but the industry had declined division recorded sales of approximately $2.5 billion by 1 to 2 percent annually for more than a decade. in 2017. The sales volume and net revenue of Quaker The overall decline in CSD consumption was a result Foods products decreased by 2 percent between 2016 of consumers' interest in healthier food and beverand 2017 as sales of ready-toeat cereals declining in age choices. In contrast, functional beverages, flasingle digits during 2017 and the sales of Roni prod- vored water, energy drinks, ready-to-drink teas, and ucts declining by nearly 10 percent between 2016 and bottled water were growing beverage categories that 2017. Quaker Oatmeal, Life cereal, and Cap'n Crunch were capturing a larger share of the stomachs in the cereal volumes competing in mature industries with United States and internationally. weak competitive positions relative to Kellogg's and PepsiCo'sCarbonatedSoft-Drink Business. PepsiCo's General Mills. Quaker Oats was the star product of CSD business had focused on product innovations to the division, with a commanding share of the North sustain sales and market share, including new formulaAmerican market for oatmeal in 2018. More than tions to lower the calorie content of non-diet drinks. one-half of Quaker Foods' 2013 revenues was gener- The strategy had produced some successes as the comated by BFY and GFY products. pany had maintained its premium pricing differential because of differentiation through innovations such as North American Beverages higher-priced 7.5-ounce cans and the 1893 line of spePepsiCo was the second largest seller of non-alcoholic cialty sodas. However, the company's CSD business beverages in North America during 2017, with a mar- could not escape the overall decline in soft drink conket share of 19 percent. Coca-Cola was the largest sumption. While the decline in sales of CSDs in North non-alcoholic beverage producer in North America, America had been an ongoing industry trend for more with a 22 percent market share in 2017. Dr. Pepper than a decade, the decline was accelerating with indusSnapple Group was the third-largest beverage seller try sales falling to a 31 year low in 2016. In addition, in 2017, with less than 10 percent market share. As bottled water sales in North America surpassed that with Frito-Lay, PepsiCo's beverage business contrib- of soft drinks for the first time ever in 2017. uted greatly to the corporation's overall profitability PepsiCo's Noncarbonated Beverage Brands. and free cash flows and was heavily impacted by Although carbonated beverages made up the largest consumer preferences for healthier food and bever- percentage of NAB's total beverage volume, much age choices. of the division's growth was attributable to the suc- In 2017, North American Beverages (NAB) cess of its noncarbonated beverages. Aquafina was accounted for 33 percent of the corporation's total the number-one brand of bottled water in the United revenues and 26 percent of its operating profits. The States. Gatorade, Tropicana, Aquafina, Starbucks NAB division's $1 billion brands included Gatorade, Frappuccino, Lipton RTD teas, and Propel were Tropicana fruit juices, Lipton ready-to-drink tea, all leading BFY and GFY beverages in the markets Pepsi, Diet Pepsi, Mountain Dew, Diet Mountain where they were sold. PepsiCo broadened its lineup Dew, Aquafina, Miranda, Sierra Mist, Dole fruit of functional beverages in 2016 with the acquisition drinks, Starbucks cold-coffee drinks, and SoBe. of KeVita sparkling probiotic drink with flavors such Analysts had noted that the strong consumer appeal as Mango Coconut, Mojito Lime Mint Coconut, and rapidly growing sales of Naked Juice might soon Lemon Ginger, and Blueberry Acai Coconut. Also, make it PepsiCo's next \$1 billion brand. the NAB division introduced LIFEWTR in 2017, Gatorade was the number-one brand of sports a purified water fortified with electrolytes as a drink sold worldwide; Tropicana was the number-two response to the increasing popularity of Coca-Cola's Smartwater. The introduction of Bubly sparkling but its sales volume of snacks and beverages declined water in 2018 was initiated to target consumers of by 1.5 percent and 2 percent, respectively, between LaCroix, a flavored sparking water that had been 2016 and 2017. The division's net price increases and produced since the 1980s but had enjoyed tremen- Performance with Purpose operating efficiencies led dous success since 2016. Sales of domestic sparkling to operating profit increases of 2 percent between water in North America doubled between 2015 and 2016 and 2017. 2017 to reach $8.5 billion. Europe, Sub-Saharan Africa Latin America All of PepsiCo's global brands were sold in Europe, PepsiCo management believed international mar- as well as its country- or region-specific brands such kets offered the company's greatest opportunity for as Domik v Derevne, Chjudo, and Agusha. PespiCo growth since per capita consumption of snacks in the Europe operated 125 plants and approximately 525 United States averaged 6.6 servings per month while warehouses, distribution centers, and offices in eastper capita consumption in other developed countries ern and western Europe. The company's acquisition averaged 4 servings per month and in developing of Wimm-Bill-Dann Foods, along with sales of its countries averaged 0.4 serving per month. PepsiCo long-time brands, made it the number-one food and executives expected China and Brazil to become beverage company in Russia, with a 2-to-1 advantage the two largest international markets for snacks, over its nearest competitor. It was also the leading with significant growth also expected in the United seller of snacks and beverages in the United Kingdom. Kingdom, Mexico, and Russia. PepsiCo Europe management believed further opporDeveloping an understanding of consumer taste tunities in other international markets existed, with preferences was a key to expanding into international opportunities to distribute many of its newest brands markets. Taste preferences for salty snacks were and product formulations throughout Europe. more similar from country to country than were pref- The division's snack volume sales increased by erences for many other food items, and this allowed 5 percent during 2017, largely because of its tremenPepsiCo to make only modest modifications to its dous success in Russia where its volume increased snacks in most countries. For example, classic variet- by nearly 10 percent between 2016 and 2017. Sales ies of Lay's, Doritos, and Cheetos snacks were sold growth in Turkey, South Africa, and the Netherlands in Latin America. In addition, consumer characteris- also contributed to the division's volume increase tics in the United States that had forced snack-food in 2017. The division's net revenues increase by makers to adopt better-for-you or good-for-you snacks 8 percent between 2016 and 2017 because of the volapplied in most other developed countries as well. ume gains and net pricing increases. Beverage sales PepsiCo operated 50 snack-food manufacturing grew at a weak one percent rate between 2016 and and processing plants and 640 warehouses in Latin 2017, but the division's operating profits increased by America, with its largest facilities located in Guarulhos, 22 percent as a result of Performance with Purpose Brazil; Monterrey, Mexico; Mexico City, Mexico; and operating efficiencies and a gain on the sale of a Celaya, Mexico. PepsiCo was the second-largest seller minority stake in its Britvic business. The divestiture of snacks and beverages in Mexico, and its Doritos, contributed 8 percentage points to the operating Marias Gamesa, Cheetos, Ruffles, Emperador, profit growth between 2016 and 2017. Saladitas, Sabritas, and Tostitos brands were popular throughout most of Latin America. The division's rev. Asia, Middle East, and North Africa enues had grown from $7.2 billion in 2011 to $8.3 bil- PepsiCo's business unit operating in Asia, the Middle lion in 2013 and accounted for 12 percent of 2013 total East, and North Africa manufactured and marketed net revenues. However, the division's revenues declined all of the company's global brands and many regional by 17 percent in 2016 as the company deconsolidated brands such as Kurkure and Chipsy. PepsiCo operits Venezuelan businesses in 2015 because of the coun- ated 45 plants, 490 distribution centers, warehouses, try's inflation and volatile currency. and offices located in Egypt, Jordan, and China and The division's revenues increased by 6 percent was the number-one brand of beverages and snacks between 2016 and 2017 as a result of price increases, in India, Egypt, Saudi Arabia, United Arab Emirates, and China. The division's revenues had declined joint distribution of Quaker snacks and Frito-Lay from $6.4 billion in 2015 to $6.0 billion in 2017 , while products. In total, the company estimated that the its operating profit had fluctuated from $941 million synergies among its business units generated approxiin 2015 to $619 in 2016 to nearly $1.1 billion in mately $1 billion annually in productivity savings. 2017. The division's revenue declines were primarily attributable to unfavorable currency exchange. The 2016 decline in operating profit resulted from PEPSICO'S STRATEGIC higher commodity costs and higher advertising and SITUATION IN 2018 marketing expenses. The operating profit increase between 2016 and 2017 was largely tied to its gain on PepsiCo's strategy keyed to building its global the refranchising of its beverage business in Jordan, brands, developing product innovations, and boostwhich contributed 14 percentage points to the overall ing productivity through efficient operations had operating profit growth. produced strong operating profits and annual free case flows through 2017. Nevertheless, the decline Value Chain Alignment between in the consumption of carbonated soft drinks and PepsiCoBrandsandProductsinternationalbusinessessignaledpossibleflawsinitsthelowrelativeprofitmarginsofsomeofPepsiCos PepsiCo's management team was dedicated to cap- corporate strategy. A lack of revenue growth and an turing strategic-fit benefits within the business lineup increased reliance on its Frito Lay North American throughout the value chain. The company's procure- business unit to maintain its annual operating profits ment activities were coordinated globally to achieve and free cash flow were troubling metrics to investhe greatest possible economies of scale, and best tors. Since 2013, the company's overall revenues and practices were routinely transferred among its more net income had declined steadily and its stock price than 200 plants, over 3,500 distribution systems, and had lagged the growth in the S\&P 500 . 120,000 service routes around the world. PepsiCo The company was aggressively pursuing a stratalso shared market research information with its divi- egy to increase its GFY and BFY brands and improve sions to better enable each division to develop new the overall healthiness of its product portfolio. Its products likely to be hits with consumers, and the acquisitions of established brands such as Gatorade company coordinated its Power of One activities and Tropicana had added to its portfolio of $1 billion across product lines. brands and new acquisitions such as Naked Juice might PepsiCo management had a proven ability to soon add to that list with healthy food and beverages. capture strategic fits between the operations of new Additional product introductions and acquisitions acquisitions and its other businesses. The Quaker such as Bubly and Bare Foods might also contribute Oats integration produced a number of noteworthy to future revenue growth. However, some food and bevsuccesses, including $160 million in cost savings erage industry analysts had speculated that additional resulting from corporatewide procurement of prod- corporate strategy changes might also be required to uct ingredients and packaging materials and an esti- restore previous revenue and earnings growth rates and mated $40 million in cost savings attributed to the lead to increases in shareholder value. epsiCo was the world's largest snack and bever- In addition to focusing on strategies designed to age company, with 2017 net revenues of approxi- deliver revenue and earnings growth, the company mately $63.5 billion. The company's portfolio maintained an aggressive share repurchase and diviof businesses in 2018 included Frito-Lay salty snacks, dend policy, with a planned $7 billion returned to Quaker Chewy granola bars, Pepsi soft-drink products, shareholders in 2018 through share repurchases of Tropicana orange juice, Lipton Brisk tea, Gatorade, $2 billion and dividends of approximately $5 billion. Propel, Bubly, Quaker Oatmeal, Cap'n Crunch, The company bolstered its cash returns through careAquafina, Rice-A-Roni, Aunt Jemima pancake mix, fully considered capital expenditures and acquisitions and many other regularly consumed products. The and a focus on operational excellence. Its Performance company viewed the lineup as highly complemen- with Purpose plan utilized investments in manufacturtary since most of its products could be consumed ing automation, a rationalized global manufacturing together. For example, Tropicana orange juice might plan, and reengineered distribution systems to drive be consumed during breakfast with Quaker Oatmeal, efficiency. In addition, the company's Performance Stacy's pita chips and Sabra hummus might make a with Purpose plan was focused on minimizing the nice snack, and Doritos and a Mountain Dew might company's impact on the environment by lowering be part of someone's lunch. In 2018, PepsiCo's busi- energy and water consumption and reducing its use ness lineup included 22$1 billion global brands. of packaging material, providing a safe and inclusive The company's top managers were focused on workplace for employees, and supporting and investsustaining the impressive performance through strat- ing in the local communities in which it operated. For egies keyed to product innovation, close relationships example, PepsiCo had expanded access to safe water with distribution allies, international expansion, to nearly 16 million people in water-stressed parts and strategic acquisitions. Newly introduced prod- of the world between 2006 and 2018. In addition, ucts such as Bubly sparkling water, Mountain Dew Performance with Purpose planned to reduce average Ice, Doritos Blaze tortilla chips, Sweet Potato Sun sugars, saturated fat, and sodium in its food and beverChips, LIFEWTR functional waters, Lemon Lemon age portfolio each year through 2025 and saved more sparkling lemonade, and the 1893 premium line of than $600 million in operating expenses by 2016 . flavored colas accounted for 15 to 20 percent of all Even though the company had recorded a new growth in recent years. New product innovations number of impressive achievements over the past that addressed consumer health and wellness con- decade, its growth had slowed since 2011. In fact, cerns were important contributors to the company's the spikes in the company's revenue growth since growth, with PepsiCo's better-for-you and good-for- 2000 had resulted from major acquisitions such as you products becoming focal points in the company's new product development initiatives. Copyright $2018 by John E. Gamble. All rights reserved. the $13.6 billion acquisition of Quaker Oats in 2001, beverage he named Pepsi-Cola. The company's saltythe 2010 acquisition of the previously independent snack business began in 1932 when Elmer Doolin, of Pepsi Bottling Group and PepsiCo Americas for San Antonio, Texas, began manufacturing and market$8.26 billion, and the acquisition of Russia's lead- ing Fritos corn chips and Herman Lay started a potato ing food-and-beverage company, Wimm-Bill-Dann chip distribution business in Nashville, Tennessee. In (WBD) Foods for $3.8 billion in 2011. Since 2011, 1961, Doolin and Lay agreed to a merger between the company had favored targeted "tuck-in" acquisi- their businesses to establish the Frito-Lay Company. tions of leading brands in popular new healthy food During PepsiCo's first five years as a snack and categories. Nevertheless, PepsiCo's revenues contin- beverage company, it introduced new products such ued to decline as annual consumption of carbonated as Doritos and Funyuns, entered markets in Japan soft drinks fell each year and its international busi- and eastern Europe, and opened, on average, one ness units struggled. A summary of PepsiCo's finan- new snack-food plant per year. By 1971, PepsiCo had cial performance between 2013 and 2017 is shown in more than doubled its revenues to reach $1 billion. Exhibit 1. Exhibit 2 tracks PepsiCo's market perfor- The company began to pursue growth through acquimance between 2013 and June 2018. sitions outside snacks and beverages as early as 1968 , but its 1977 acquisition of Pizza Hut significantly COMPANY HISTORY Shaped the strategic direction of PepsiCo for the next Kentucky Fried Chicken in 1986 created a business Cola and Frito-Lay shareholders agreed to a merger portfolio described by Wayne Calloway (PepsiCo's between the salty-snack icon and soft-drink giant. The CEO between 1986 and 1996) as a balanced threenew company was founded with annual revenues of legged stool. Calloway believed the combination of $510 million and such well-known brands as Pepsi- snack foods, soft drinks, and fast food offered considCola, Mountain Dew, Fritos, Lay's, Cheetos, Ruffles, erable cost sharing and skill transfer opportunities, and Rold Gold. PepsiCo's roots can be traced to and he routinely shifted managers among the com1898 when New Bern, North Carolina, pharmacist pany's three divisions as part of the company's manCaleb Bradham created the formula for a carbonated agement development efforts. EXHIBIT 1 Financial Summary for PepsiCo, Inc., 2013-2017 (in millions, except per share amounts) EXHIBIT 2 Monthly Performance of PepsiCo, Inc.'s Stock Price, June 2013June 2018 (a) Trend in PepsiCo, Inc.'s Common Stock Price (b) Performance of PepsiCo, Inc.'s Stock Price versus the S\&P 500 Index PepsiCo strengthened its portfolio of snack foods By 1996 it had become clear to PepsiCo manageand beverages during the 1980 s and 1990 s with the ment that the potential strategic-fit benefits existing acquisitions of Mug Root Beer, 7-Up International, between restaurants and PepsiCo's core beverage and Smartfood ready-to-eat popcorn, Walker's Crisps snack businesses were difficult to capture. In addi(United Kingdom), Smith's Crisps (United tion, any synergistic benefits achieved were more Kingdom), Mexican cookie company Gamesa, and than offset by the fast-food industry's fierce price Sunchips. Calloway added quick-service restaurants competition and low profit margins. In 1997, CEO Hot-n-Now in 1990; California Pizza Kitchens in Roger Enrico spun off the company's restaurants as 1992; and East Side Mario's, D'Angelo Sandwich an independent, publicly traded company to focus Shops, and Chevy's Mexican Restaurants in 1993. PepsiCo on food and beverages. Soon after the spinThe company expanded beyond carbonated bever- off of PepsiCo's fast-food restaurants was completed, ages through a 1992 agreement with Ocean Spray Enrico acquired Cracker Jack, Tropicana, Smith's to distribute single-serving juices, the introduction Snackfood Company in Australia, SoBe teas and of Lipton ready-to-drink (RTD) teas in 1993, and alternative beverages, Tasali Snack Foods (the leader the introduction of Aquafina bottled water and in the Saudi Arabian salty-snack market), and the Frappuccino ready-to-drink coffees in 1994. Quaker Oats Company. PepsiCo's Better for You and Russian beverage producer Lebedyansky in 2008 for Good for You Acquisitions $1.8 billion, and in 2010 it acquired Marbo, a potato PepsiCo's $13.9 billion acquisition of Quaker Oats chip production operation in Serbia. in 2001 was the company's largest ever acquisition In 2010 and 2011, the company executed its larg. and gave it the number-one brand of oatmeal in the share; the leading brand of rice cakes and granola pendent Pepsi Bottling Group and PepsiCo Americas snack bars; and other well-known grocery brands grate its global distribution system for its beverage Gatorade was developed by and beverage company, Wimm-Bill-Dann Foods, for Florida researchers in 1965 , but it was not marketed Van Camp in 1967. When Quaker Bacquired the business allowed the company's revenues to increase from approximately $29 billion in 2004 to more than gradually made a transformation from a regionally PepsiCo made small "tuck-in" acquisitions totaldistributed product with annual sales of $90 million ing less than $500 million annually after its acquito a $2 billion powerhouse. Gatorade was able to sition of Wimm-Bill-Dann Foods. The company's increase sales by more than 10 percent annually dur- $200 million acquisition of sparkling probiotic bevering the 1990 s, with no new entrant to the sports bev- age brand, Kevita, in 2016 and its 2018 acquisition of erage category posing a serious threat to the brand's Bare Foods for an undisclosed amount were its most dominance. PepsiCo, Coca-Cola, France's Danone noteworthy acquisitions made after 2010. Both acquiGroup, and Swiss food giant Nestle all were attracted sitions were intended to expand its lineup of lower calto Gatorade because of its commanding market share orie and lower sodium "Guilt-Free Products." Global and because of the expected growth in the isotonic sales of health foods were estimated at $1 trillion in sports beverage category. 2017. The sales of Better for You (BFY) and Good for You (GFY) brands accounted for approximately PepsiCo's Focus on "Tuck-In" 50 percent of PepsiCo's annual sales in that year. Acquisitions (2002 to 2018) Exhibit 3 presents PepsiCo's consolidated statements After the completion of the Quaker Oats acquisition in Of income for 2015 to 2017, while the company's 2001 , the company focused on integration of Quaker Exhibit 4. The company's calculation of free cash PepsiCo portfolio. The company made a number of "tuck-in" acquisitions of small, fast-growing food and beverage companies in the United States and inter- PEPSICO'S BUSINESS UNIT nationally to broaden its portfolio of brands. Tuck-in acquisitions in 2006 included Stacey's bagel and pita chips, Izze carbonated beverages, Netherlands-based PepsiCo's corporate strategy had diversified the comDuyvis nuts, and Star Foods (Poland). Acquisitions pany into salty and sweet snacks, soft drinks, orange made during 2007 included Naked Juice fruit bever- juice, bottled water, ready-to-drink teas and coffees, ages, Sandora juices in the Ukraine, New Zealand's purified and functional waters, isotonic beverages, Bluebird snacks, Penelopa nuts and seeds in Bulgaria, hot and ready-to-eat breakfast cereals, grain-based and Brazilian snack producer Lucky. The company products, and breakfast condiments. Most PepsiCo also entered into a joint venture with the Strauss brands had achieved number-one or number-two posiGroup in 2007 to market Sabra-the top-selling and tions in their respective food and beverage categories fastestgrowing brand of hummus in the United through strategies keyed to product innovation, close States and Canada. The company acquired the relationships with distribution allies, international EXHIBIT 3 PepsiCo, Inc.'s Consolidated Statements of Income, 2015-2017 (in millions, except per share data) Source: PepsiCo, inc. 201710K. EXHIBIT 4 PepsiCo, Inc.'s Consolidated Balance Sheets, 2016-2017 (in millions, except per share data) EXHIBIT 4 (Continued) Prepaid expenses and other current assets Total Current Assets Property, Plant and Equipment, net Amortizable Intangible Assets, net Goodwill Other nonamortizable intangible assets Nonamortizable Intangible Assets Investments in Noncontrolled Affiliates Other Assets Total Assets \begin{tabular}{rr} 1,546 & 908 \\ & 26,450 \\ 17,240 & 16,591 \\ 1,268 & 1,237 \\ 14,744 & 14,430 \\ 12,570 & 12,196 \\ \hline 27,314 & 26,626 \\ 2,042 & 1,950 \\ 913 & 636 \\ \hline$79,804 & $73,490 \end{tabular} LIABILITIES AND EQUITY Current Liabilities Short-term debt obligations Accounts payable and other current liabilities Total Current Liabilities Long-Term Debt Obligations Other Liabilities Deferred Income Taxes Total Liabilities \begin{tabular}{rr} $5,485 & $6,892 \\ 15,017 & 14,243 \\ \hline 20,502 & 21,135 \\ 33,796 & 30,053 \\ 11,283 & 6,669 \\ 3,242 & 4,434 \\ \hline 68,823 & 62,291 \end{tabular} Commitments and contingencies Preferred Stock, no par value Repurchased Preferred Stock (197) (192) PepsiCo Common Shareholders' Equity Common stock, par value 12/3 cents per share (authorized 3,600 shares, 24 24 issued, net of repurchased common stock at par value: 1,420 and 1,428 shares, respectively) Capital in excess of par value Retained earnings Accumulated other comprehensive loss Repurchased common stock, in excess of par value ( 446 and 438 shares, respectively) Total PepsiCo Common Shareholders Equity Noncontrolling interests Total Equity Total Liabilities and Equity Source: PepsiCo, Inc. 201710K expansion, and strategic acquisitions. The company Frito-Lay North America was committed to producing the highest-quality products in each category and was working diligently As of 2018 , key trends that were shaping the induson product reformulations to make snack foods and try were a growing awareness of the nutritional conbeverages less unhealthy. The company believed that tent of snack foods and product innovation. Most its efforts to develop good-for-you and better-for-you manufacturers had developed new flavors of salty products would create growth opportunities from the snacks such as nacho cheese tortilla chips and sea intersection of business and public interests. salt and vinegar potato chips to attract the interest of PepsiCo was organized into six business divi- snackers. PepsiCo continued to innovate to increase sions, which all followed the corporation's general its share of snack foods with new varieties of chips strategic approach. Frito-Lay North America manu- like Lay's Poppables, Simply Organic Doritos, and factured, marketed, and distributed such snack foods Himalayan Pink Salt Red Rock Deli chips. as Lay's potato chips, Doritos tortilla chips, Cheetos In 2018, Frito-Lay owned the top-selling chip cheese snacks, Fritos corn chips, Grandma's cook- brand in each U.S. salty-snack category and held ies, and Smartfood popcorn. Quaker Foods North more than a 2-to-1 lead over the next-largest snackAmerica manufactured and marketed cereals, rice and food maker in the United States. Frito-Lay's market pasta dishes, granola bars, and other food items that share of convenience foods sold in the United States were sold in supermarkets. North America Beverages was more than five times greater than runner-up manufactured, marketed, and sold beverage concen- Kellogg's market share. Convenience foods included trates, fountain syrups, and finished goods under both salty and sweet snacks such as chips, pretzels. such brands as Pepsi, Gatorade, Aquafina, Tropicana, ready-to-eat popcorn, crackers, dips, snack nuts and Lipton, Dole, and Propel throughout North America. seeds, candy bars, and cookies. Latin America manufactured, marketed, and distrib-_ Innovations were also directed at making increasuted snack foods and many Quaker-branded cereals ing the percentage of sales of BFY and GFY products. and snacks in Latin America. The division also pro- By 2025, Frito Lay North America (FLNA) expected duced, marketed, distributed and sold PepsiCo bev- that 75 percent of its global foods portfolio volume erage brands in Latin America. Europe Sub-Saharan would not exceed 1.3 milligrams of sodium per caloAfrica manufactured, marketed, and sold snacks and ries and 1.1 grams of saturated fat per 100 calories. beverages throughout Europe and the lower portion Good-for-you (GFY) snacks, such as Bare Foods of the African continent, while the company's Asia, baked fruit and vegetable snacks acquired in 2018 , Middle East, and North Africa division produced, offered an opportunity for the company to exploit marketed, and distributed snack brands and bever- consumers' desires for healthier snacks and address a ages in more than 150 countries in those regions. A deficiency in most diets. Americans, on average, conlisting of PepsiCo's leading brands is presented in sumed only about 50 percent of the U.S. Department Exhibit 6. Select financial information for PepsiCo's of Agriculture's recommended daily diet of fruits and six reporting units is presented in Exhibit 7. vegetables. Other GFY snacks included Stacy's Pita EXHIBIT 6 PepsiCo, Inc.'s Leading Brands by Category, 2018 Source: Popsico.com. EXHIBIT 7 Select Financial Data for PepsiCo, Inc.'s Business Segments, 2015-2017 (in millions) Chips, Sabra hummus, salsas and dips, and Quaker for the effect of a 53rd reporting week in 2017 and Chewy granola bars. In 2018. FLNA manufactured its volume declined by 1 percent between 2016 and and marketed baked versions of its most popular 2017. The decline in volume and flat revenues were products, such as Cheetos, Lay's potato chips, Ruffles reflective of the growing emphasis of consumers on potato chips, and Tostitos tortilla chips. healthy snacking. However, the division was able to PepsiCo's Performance with Purpose goals boost operating profit by 3.5 percent between 2016 and applied to all of its business units. Frito-Lay North 2017 through its focus on Performance with Purpose America's revenues were unchanged after correcting cost reduction strategies and operating practices. The division produced 25 percent of PepsiCo's net rev- seller of juice and juice drinks globally; and NAB enues in 2017 and 46 percent of its operating profit. was the second-largest seller of carbonated soft drinks worldwide, with an approximate 27 percent Quaker Foods North America market share in 2017. Market leader Coca-Cola held Quaker Foods North American (QFNA) produced, approximately 42 percent share of the carbonated marketed, and distributed hot and ready-to-eat cere soft-drink (CSD) industry in 2017. Carbonated soft als, pancake mixes and syrups, and rice and pasta drinks were the most consumed type of beverage side dishes in the United States and Canada. The in the United States, but the industry had declined division recorded sales of approximately $2.5 billion by 1 to 2 percent annually for more than a decade. in 2017. The sales volume and net revenue of Quaker The overall decline in CSD consumption was a result Foods products decreased by 2 percent between 2016 of consumers' interest in healthier food and beverand 2017 as sales of ready-toeat cereals declining in age choices. In contrast, functional beverages, flasingle digits during 2017 and the sales of Roni prod- vored water, energy drinks, ready-to-drink teas, and ucts declining by nearly 10 percent between 2016 and bottled water were growing beverage categories that 2017. Quaker Oatmeal, Life cereal, and Cap'n Crunch were capturing a larger share of the stomachs in the cereal volumes competing in mature industries with United States and internationally. weak competitive positions relative to Kellogg's and PepsiCo'sCarbonatedSoft-Drink Business. PepsiCo's General Mills. Quaker Oats was the star product of CSD business had focused on product innovations to the division, with a commanding share of the North sustain sales and market share, including new formulaAmerican market for oatmeal in 2018. More than tions to lower the calorie content of non-diet drinks. one-half of Quaker Foods' 2013 revenues was gener- The strategy had produced some successes as the comated by BFY and GFY products. pany had maintained its premium pricing differential because of differentiation through innovations such as North American Beverages higher-priced 7.5-ounce cans and the 1893 line of spePepsiCo was the second largest seller of non-alcoholic cialty sodas. However, the company's CSD business beverages in North America during 2017, with a mar- could not escape the overall decline in soft drink conket share of 19 percent. Coca-Cola was the largest sumption. While the decline in sales of CSDs in North non-alcoholic beverage producer in North America, America had been an ongoing industry trend for more with a 22 percent market share in 2017. Dr. Pepper than a decade, the decline was accelerating with indusSnapple Group was the third-largest beverage seller try sales falling to a 31 year low in 2016. In addition, in 2017, with less than 10 percent market share. As bottled water sales in North America surpassed that with Frito-Lay, PepsiCo's beverage business contrib- of soft drinks for the first time ever in 2017. uted greatly to the corporation's overall profitability PepsiCo's Noncarbonated Beverage Brands. and free cash flows and was heavily impacted by Although carbonated beverages made up the largest consumer preferences for healthier food and bever- percentage of NAB's total beverage volume, much age choices. of the division's growth was attributable to the suc- In 2017, North American Beverages (NAB) cess of its noncarbonated beverages. Aquafina was accounted for 33 percent of the corporation's total the number-one brand of bottled water in the United revenues and 26 percent of its operating profits. The States. Gatorade, Tropicana, Aquafina, Starbucks NAB division's $1 billion brands included Gatorade, Frappuccino, Lipton RTD teas, and Propel were Tropicana fruit juices, Lipton ready-to-drink tea, all leading BFY and GFY beverages in the markets Pepsi, Diet Pepsi, Mountain Dew, Diet Mountain where they were sold. PepsiCo broadened its lineup Dew, Aquafina, Miranda, Sierra Mist, Dole fruit of functional beverages in 2016 with the acquisition drinks, Starbucks cold-coffee drinks, and SoBe. of KeVita sparkling probiotic drink with flavors such Analysts had noted that the strong consumer appeal as Mango Coconut, Mojito Lime Mint Coconut, and rapidly growing sales of Naked Juice might soon Lemon Ginger, and Blueberry Acai Coconut. Also, make it PepsiCo's next \$1 billion brand. the NAB division introduced LIFEWTR in 2017, Gatorade was the number-one brand of sports a purified water fortified with electrolytes as a drink sold worldwide; Tropicana was the number-two response to the increasing popularity of Coca-Cola's Smartwater. The introduction of Bubly sparkling but its sales volume of snacks and beverages declined water in 2018 was initiated to target consumers of by 1.5 percent and 2 percent, respectively, between LaCroix, a flavored sparking water that had been 2016 and 2017. The division's net price increases and produced since the 1980s but had enjoyed tremen- Performance with Purpose operating efficiencies led dous success since 2016. Sales of domestic sparkling to operating profit increases of 2 percent between water in North America doubled between 2015 and 2016 and 2017. 2017 to reach $8.5 billion. Europe, Sub-Saharan Africa Latin America All of PepsiCo's global brands were sold in Europe, PepsiCo management believed international mar- as well as its country- or region-specific brands such kets offered the company's greatest opportunity for as Domik v Derevne, Chjudo, and Agusha. PespiCo growth since per capita consumption of snacks in the Europe operated 125 plants and approximately 525 United States averaged 6.6 servings per month while warehouses, distribution centers, and offices in eastper capita consumption in other developed countries ern and western Europe. The company's acquisition averaged 4 servings per month and in developing of Wimm-Bill-Dann Foods, along with sales of its countries averaged 0.4 serving per month. PepsiCo long-time brands, made it the number-one food and executives expected China and Brazil to become beverage company in Russia, with a 2-to-1 advantage the two largest international markets for snacks, over its nearest competitor. It was also the leading with significant growth also expected in the United seller of snacks and beverages in the United Kingdom. Kingdom, Mexico, and Russia. PepsiCo Europe management believed further opporDeveloping an understanding of consumer taste tunities in other international markets existed, with preferences was a key to expanding into international opportunities to distribute many of its newest brands markets. Taste preferences for salty snacks were and product formulations throughout Europe. more similar from country to country than were pref- The division's snack volume sales increased by erences for many other food items, and this allowed 5 percent during 2017, largely because of its tremenPepsiCo to make only modest modifications to its dous success in Russia where its volume increased snacks in most countries. For example, classic variet- by nearly 10 percent between 2016 and 2017. Sales ies of Lay's, Doritos, and Cheetos snacks were sold growth in Turkey, South Africa, and the Netherlands in Latin America. In addition, consumer characteris- also contributed to the division's volume increase tics in the United States that had forced snack-food in 2017. The division's net revenues increase by makers to adopt better-for-you or good-for-you snacks 8 percent between 2016 and 2017 because of the volapplied in most other developed countries as well. ume gains and net pricing increases. Beverage sales PepsiCo operated 50 snack-food manufacturing grew at a weak one percent rate between 2016 and and processing plants and 640 warehouses in Latin 2017, but the division's operating profits increased by America, with its largest facilities located in Guarulhos, 22 percent as a result of Performance with Purpose Brazil; Monterrey, Mexico; Mexico City, Mexico; and operating efficiencies and a gain on the sale of a Celaya, Mexico. PepsiCo was the second-largest seller minority stake in its Britvic business. The divestiture of snacks and beverages in Mexico, and its Doritos, contributed 8 percentage points to the operating Marias Gamesa, Cheetos, Ruffles, Emperador, profit growth between 2016 and 2017. Saladitas, Sabritas, and Tostitos brands were popular throughout most of Latin America. The division's rev. Asia, Middle East, and North Africa enues had grown from $7.2 billion in 2011 to $8.3 bil- PepsiCo's business unit operating in Asia, the Middle lion in 2013 and accounted for 12 percent of 2013 total East, and North Africa manufactured and marketed net revenues. However, the division's revenues declined all of the company's global brands and many regional by 17 percent in 2016 as the company deconsolidated brands such as Kurkure and Chipsy. PepsiCo operits Venezuelan businesses in 2015 because of the coun- ated 45 plants, 490 distribution centers, warehouses, try's inflation and volatile currency. and offices located in Egypt, Jordan, and China and The division's revenues increased by 6 percent was the number-one brand of beverages and snacks between 2016 and 2017 as a result of price increases, in India, Egypt, Saudi Arabia, United Arab Emirates, and China. The division's revenues had declined joint distribution of Quaker snacks and Frito-Lay from $6.4 billion in 2015 to $6.0 billion in 2017 , while products. In total, the company estimated that the its operating profit had fluctuated from $941 million synergies among its business units generated approxiin 2015 to $619 in 2016 to nearly $1.1 billion in mately $1 billion annually in productivity savings. 2017. The division's revenue declines were primarily attributable to unfavorable currency exchange. The 2016 decline in operating profit resulted from PEPSICO'S STRATEGIC higher commodity costs and higher advertising and SITUATION IN 2018 marketing expenses. The operating profit increase between 2016 and 2017 was largely tied to its gain on PepsiCo's strategy keyed to building its global the refranchising of its beverage business in Jordan, brands, developing product innovations, and boostwhich contributed 14 percentage points to the overall ing productivity through efficient operations had operating profit growth. produced strong operating profits and annual free case flows through 2017. Nevertheless, the decline Value Chain Alignment between in the consumption of carbonated soft drinks and PepsiCoBrandsandProductsinternationalbusinessessignaledpossibleflawsinitsthelowrelativeprofitmarginsofsomeofPepsiCos PepsiCo's management team was dedicated to cap- corporate strategy. A lack of revenue growth and an turing strategic-fit benefits within the business lineup increased reliance on its Frito Lay North American throughout the value chain. The company's procure- business unit to maintain its annual operating profits ment activities were coordinated globally to achieve and free cash flow were troubling metrics to investhe greatest possible economies of scale, and best tors. Since 2013, the company's overall revenues and practices were routinely transferred among its more net income had declined steadily and its stock price than 200 plants, over 3,500 distribution systems, and had lagged the growth in the S\&P 500 . 120,000 service routes around the world. PepsiCo The company was aggressively pursuing a stratalso shared market research information with its divi- egy to increase its GFY and BFY brands and improve sions to better enable each division to develop new the overall healthiness of its product portfolio. Its products likely to be hits with consumers, and the acquisitions of established brands such as Gatorade company coordinated its Power of One activities and Tropicana had added to its portfolio of $1 billion across product lines. brands and new acquisitions such as Naked Juice might PepsiCo management had a proven ability to soon add to that list with healthy food and beverages. capture strategic fits between the operations of new Additional product introductions and acquisitions acquisitions and its other businesses. The Quaker such as Bubly and Bare Foods might also contribute Oats integration produced a number of noteworthy to future revenue growth. However, some food and bevsuccesses, including $160 million in cost savings erage industry analysts had speculated that additional resulting from corporatewide procurement of prod- corporate strategy changes might also be required to uct ingredients and packaging materials and an esti- restore previous revenue and earnings growth rates and mated $40 million in cost savings attributed to the lead to increases in shareholder value
Step by Step Solution
There are 3 Steps involved in it

Get step-by-step solutions from verified subject matter experts