

Question: Please write a summery regarding this topic(short-run and long-run demand and supply responses )based on the attached article. Also , please answer the questions at
Please write a summery regarding this topic(short-run and long-run demand and supply responses )based on the attached article. Also , please answer the questions at the end of the article.
The words should be around 800-1400 words.
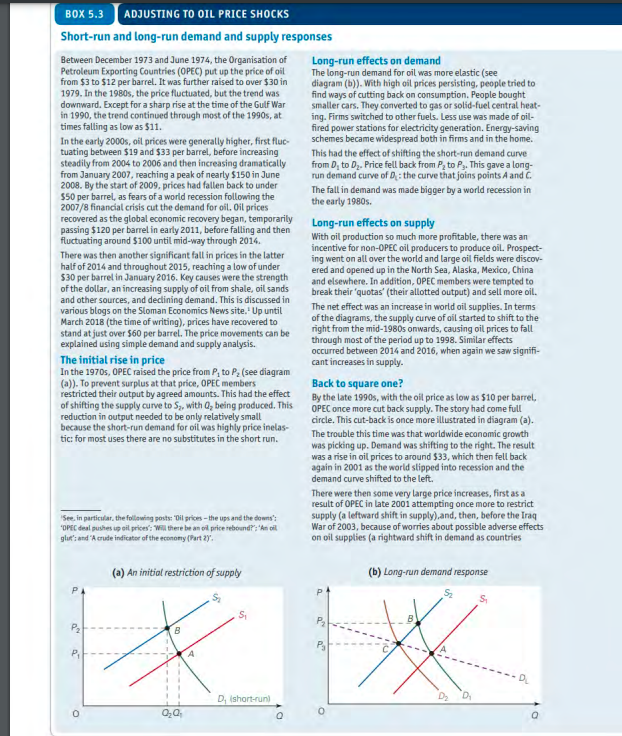
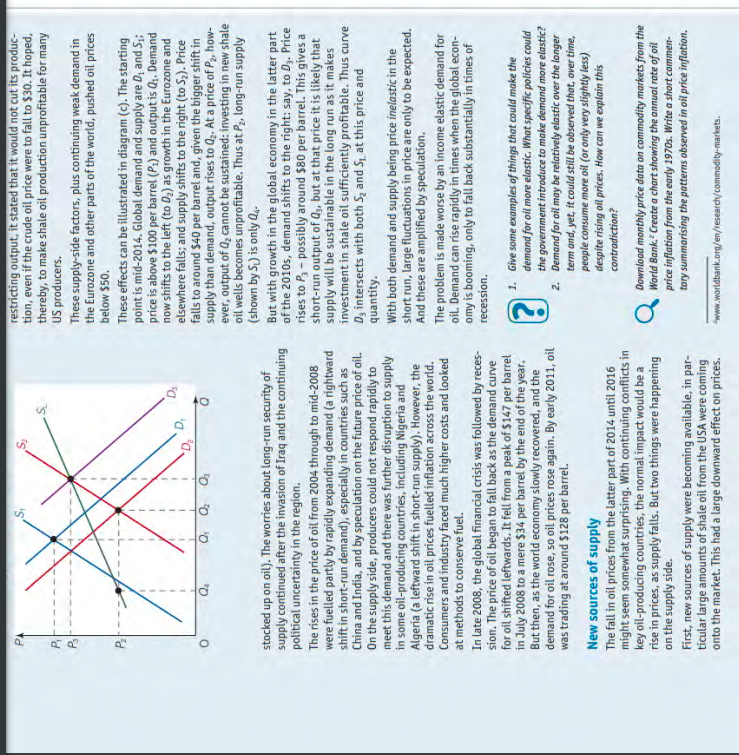
Between December 1973 and June 1974, the Organisation of Long-run effects on demand Petroleum Exporting Countries (OPEC) put up the price of oil The long-run demand for oil was more elastic (see from $3 to $12 per barrel. It was further raised to over $30 in diagram (b)). With high oil prices persisting, people tried to 1979. In the 19805, the price fluctuated, but the trend was find ways of cutting back on consumption. People bought downward. Except for a sharp rise at the time of the Gulf War smaller cars. They converted to gas or solid-fuel central heatin 1990, the trend continued through most of the 1990s, at ing. Firms switched to other fuels. Less use was made of oiltimes falling as low as $11. fired power stations for electricity generation. Energy-saving In the early 2000 s, oil prices were generally higher, first fluc-_ schemes became widespread both in firms and in the home. tuating between $19 and $33 per barrel, before increasing This had the effect of shifting the short-run demand curve steadily from 2004 to 2006 and then increasing dramatically from D1 to D2. Price fell back from P2 to P3. This gave a longfrom January 2007, reaching a peak of nearly $150 in June run demand curve of Dt : the curve that joins points A and C. 2008. By the start of 2009, prices had fallen back to under $50 per barrel, as fears of a world recession following the The fall in demand was made bigger by a world recession in 2007/8 financial crisis cut the demand for oil, 0il prices recovered as the global economic recovery began, temporarily Long-run effects on supply passing $120 per barrel in early 2011 , before falling and then fluctuating around $100 until mid-way through 2014 . With oil production so much more profitable, there was an There was then another significant fall in prices in the latter incentive for non-OPEC oil producers to produce oil. Prospecthalf of 2014 and throughout 2015, reaching a low of under ing went on all over the world and large oil fields were discov$30 per barrel in January 2016. Key causes were the strength ered and opened up in the North Sea, Alaska, Mexico, China of the dollar, an increasing supply of oil from shale, oil sands._ and elsewhere. In addition, OPEC members were tempted to and other sources, and declining demand. This is discussed in break their 'quotas' (their allotted output) and sell more oil. various blogs on the Sloman Economics News site, 1 Up until The net effect was an increase in world oil supplies. In terms March 2018 (the time of writing), prices have recovered to_ of the diagrams, the supply curve of oil started to shift to the stand at just over $60 per barrel. The price movements can be_ right from the mid-1980s onwards, causing oil prices to fall. explained using simple demand and supply analysis. through most of the period up to 1998 . Similar effects The initial rise in price occurred between 2014 and 2016, when again we saw signifiIn the 1970 s, 0PEC raised the price from P1 to P2 (see diagram cant increases in supply. (a)). To prevent surplus at that price, 0PEC members Back to square one? restricted their output by agreed amounts. This had the effect of shifting the supply curve to S2, with Q2 being produced. This_ By the late 1990 s, with the oil price as low as $10 per barrel. reduction in output needed to be only relatively small OPEC once more cut back supply. The story had come full because the short-run demand for oil was highly price inelascircle. This cut-back is once more illustrated in diagram (a). tic: for most uses there are no substitutes in the short run. The trouble this time was that worldwide economic growth was picking up. Demand was shifting to the right. The result was a rise in oil prices to around \$33, which then fell back again in 2001 as the world slipped into recession and the demand curve shifted to the left. There were then some very large price increases, first as a result of OPEC in late 2001 attempting once more to restrict. 'See in particular, the following posts: 'Dil grices - the ups and the downs': supply (a leftward shift in supply), and, then, before the Iraq 'OPe' deal pushes ip oil prices'; "Win there be an of price rebound?'; 'An oil War of 2003, because of worries about possible adverse effects glue's and 'A coude indicator of the econony (Fart 2) '. on oil supplies (a rightward shift in demand as countries (a) An initiol restriction of supply (b) Long-run demand response restricting output, it stated that it would not cut its production, even if the crude oil price were to fall to $30. It hoped, thereby, to make shale oil production unprofitable for many US producers. These supply-side factors, plus continuing weak demand in the Eurozone and other parts of the world, pushed oil prices below $50. These effects can be illustrated in diagram (c). The starting point is mid-2014. Global demand and supply are D1 and S1; price is above $100 per barrel (P1) and output is Q1. Demand now shifts to the left (to D2 ) as growth in the Eurozone and elsewhere falls; and supply shifts to the right (to S2 ). Price falls to around $40 per barrel and, given the bigger shift in supply than demand, output rises to Q2. At a price of P2, however, output of Q2 cannot be sustained: investing in new shale oil wells becomes unprofitable. Thus at P2, long-run supply (shown by SL ) is only Q4. stocked up on oil). The worries about long-run security of supply continued after the invasion of Iraq and the continuing But with growth in the global economy in the latter part political uncertainty in the region. of the 2010s, demand shifts to the right: say, to D3. Price The rises in the price of oil from 2004 through to mid-2008 short-run output of Q3, but at that price it is likely that were fuelled partly by rapidly expanding demand (a rightward supply will be sustainable in the long run as it makes shift in short-run demand), especially in countries such as investment in shale oil sufficiently profitable. Thus curve China and India, and by speculation on the future price of oil. D3 intersects with both S2 and S1 at this price and On the supply side, producers could not respond rapidly to quantity. meet this demand and there was further disruption to supply With both demand and supply being price inelastic in the in some oil-producing countries, including Nigeria and Algeria (a leftward shift in short-run supply). However, the short run, large fluctuations in price are only to be expected. dramatic rise in oil prices fuelled inflation across the world. And these are amplified by speculation. Consumers and industry faced much higher costs and looked The problem is made worse by an income elastic demand for at methods to conserve fuel. oil. Demand can rise rapidly in times when the global econIn late 2008, the global financial crisis was followed by reces-__ omy is booming, only to fall back substantially in times of sion. The price of oil began to fall back as the demand curve _. ression. for oil shifted leftwards. It fell from a peak of \$147 per barrel in July 2008 to a mere $34 per barrel by the end of the year. 1. Give some examples of things that could make the But then, as the world economy slowly recovered, and the demand for oil more elastic. What specific policies could demand for oil rose, so oil prices rose again. By early 2011, oil the government introduce to make demand more elastic? was trading at around $128 per barrel. 2. Demand for oil may be relatively elastic over the longer term and, yet, it could still be observed that, over time, New sources of supply people consume more oil (or only very slightly less) The fall in oil prices from the latter part of 2014 until 2016 despite rising oil prices. How can we explain this might seem somewhat surprising. With continuing conflicts in key oil-producing countries, the normal impact would be a contradiction? rise in prices, as supply falls. But two things were happening Download monthly price data on commodity markets from the on the supply side. World Bank.2 Create a chart showing the annual rate of oil First, new sources of supply were becoming available, in parprice inflation from the early 1970 s. Write a short commenticular large amounts of shale oil from the USA were coming onto the market. This had a large downward effect on prices. tary summarising the patterns abserved in oil price inflationStep by Step Solution
There are 3 Steps involved in it
1 Expert Approved Answer
Step: 1 Unlock

Question Has Been Solved by an Expert!
Get step-by-step solutions from verified subject matter experts
Step: 2 Unlock
Step: 3 Unlock