

Question: please write a write up following the guideline listed above about the information listed below. thanks Part two is your Write-up. Your case write-up needs


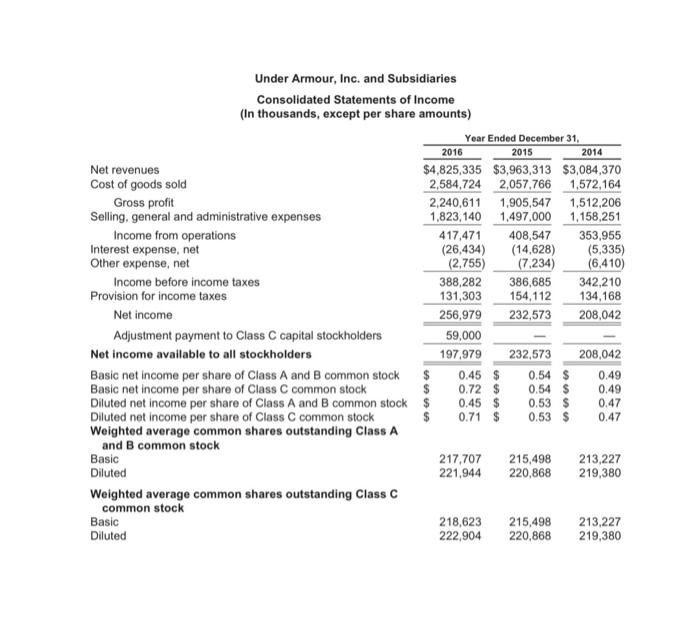


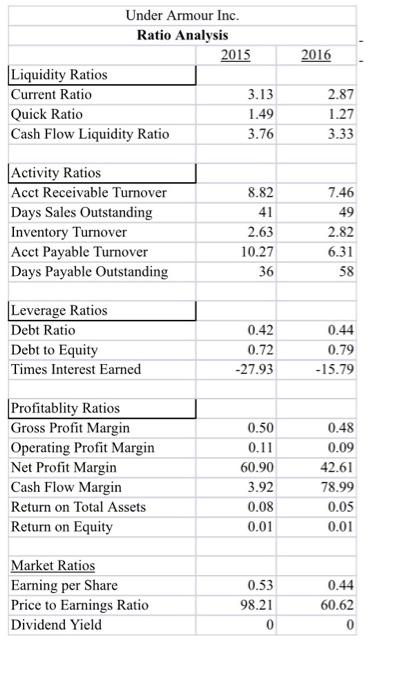

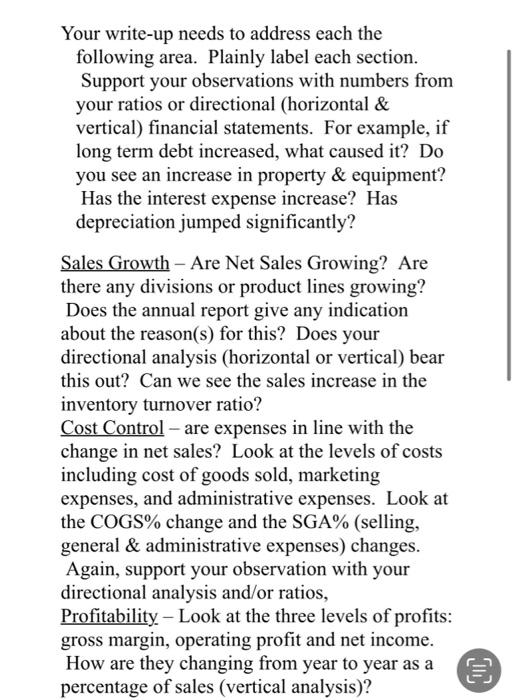

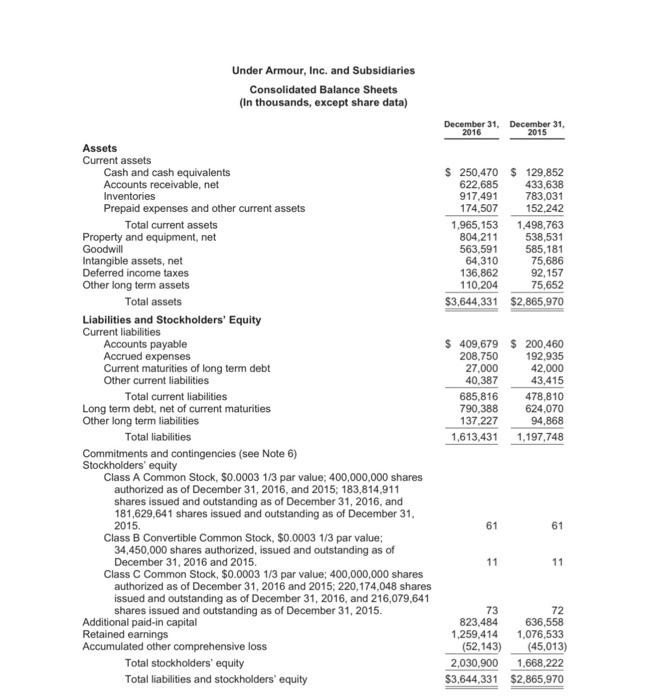

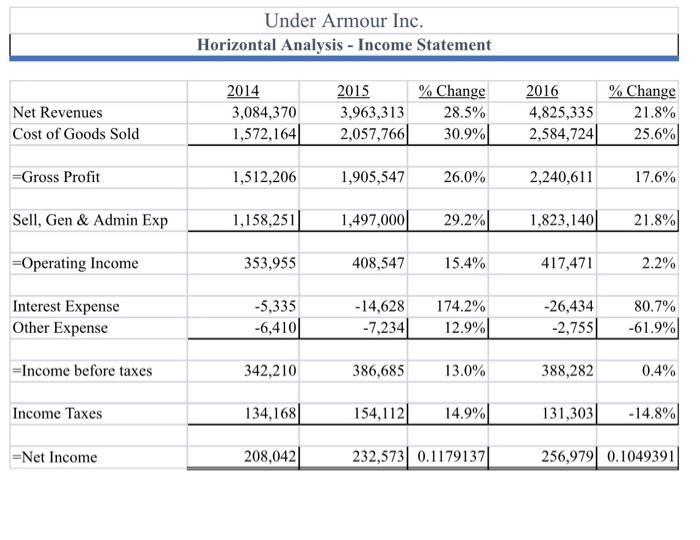
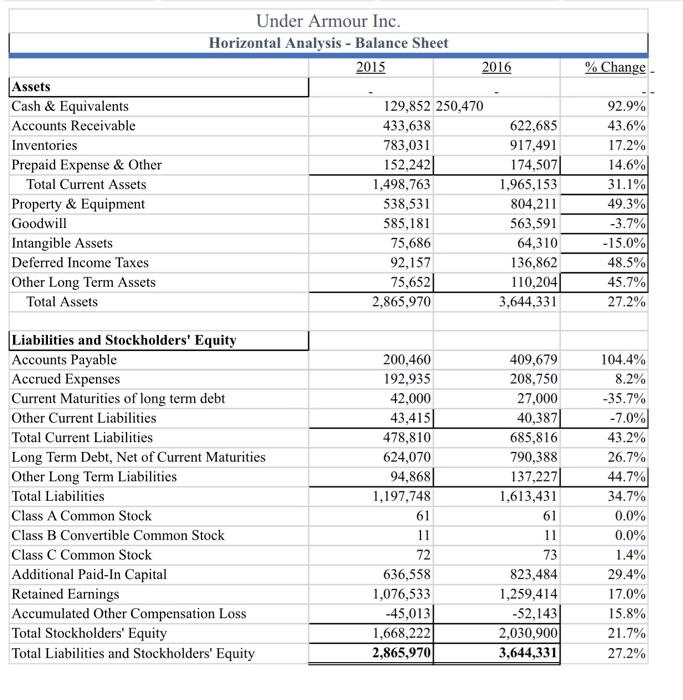

Part two is your Write-up. Your case write-up needs to be a Word document. Please see the document in the module "Write-up Suggested Guidelines" Your write-up needs to address each the following area. Plainly label each section. Support your observations with numbers from your ratios or directional (horizontal & vertical) financial statements. For example, if long term debt increased, what caused it? Do you see an increase in property & equipment? Has the interest expense increase? Has depreciation jumped significantly? Sales Growth - Are Net Sales Growing? Are there any divisions or product lines growing? Does the annual report give any indication about the reason(s) for this? Does your directional analysis (horizontal or vertical) bear this out? Can we see the sales increase in the inventory turnover ratio? Cost Control - are expenses in line with the change in net sales? Look at the levels of costs including cost of goods sold, marketing expenses, and administrative expenses. Look at the COGS% change and the SGA% (selling, general & administrative expenses) changes. Again, support your observation with your directional analysis and/or ratios, Profitability - Look at the three levels of profits: gross margin, operating profit and net income. How are they changing from year to year as a percentage of sales (vertical analysis)? C00 Cash Flow and Liquidity - Is cash increasing or decreasing. Does that make sense in light of the profits? What about the liquidity ratios? Did you find a change in the current or the quick ratio? Look at the cash flow statements. Is operations generating or consuming cash? Is the growth of inventory reasonable as compared to the growing of cost of goods sold? Look at the accounts payable turnover ratio. And don't forget about accounts receivable and its change. Are you concerned with changes in the accounts receivable turnover ratio? Debt Levels - Is debt increasing or decreasing? Looks at the change in current and long-term liabilities in your directional analyses. What are the reasons for this change? Look at your debt ratios. Is there anything in annual report or outside articles to explain a significant change in debt, if you find one? Equity and Stock Market Factors - Has common stock plus the paid in capital on common stock increased? Has it decreased from a buyback of common stock (treasury stock)? What about the price of the stock, has it changed significant over the years of your analysis. Look at the price to earnings ratio and the dividend yield ratio. Do not put a lot of marketing promotional information into your write-up. If the MD&A from the annual report discussed marketing problems that help explain the financials, that would be useful. Assets Current assets Under Armour, Inc. and Subsidiaries Consolidated Balance Sheets (In thousands, except share data) Cash and cash equivalents Accounts receivable, net Inventories Prepaid expenses and other current assets Total current assets Property and equipment, net Goodwill Intangible assets, net Deferred income taxes Other long term assets Total assets Liabilities and Stockholders' Equity Current liabilities Accounts payable Accrued expenses Current maturities of long term debt Other current liabilities Total current liabilities Long term debt, net of current maturities Other long term liabilities Total liabilities Commitments and contingencies (see Note 6) Stockholders' equity Class A Common Stock, $0.0003 1/3 par value; 400,000,000 shares authorized as of December 31, 2016, and 2015; 183,814,911 shares issued and outstanding as of December 31, 2016, and 181,629,641 shares issued and outstanding as of December 31, 2015. Class B Convertible Common Stock, $0.0003 1/3 par value; 34,450,000 shares authorized, issued and outstanding as of December 31, 2016 and 2015. Class C Common Stock, $0.0003 1/3 par value; 400,000,000 shares authorized as of December 31, 2016 and 2015; 220,174,048 shares issued and outstanding as of December 31, 2016, and 216,079,641 shares issued and outstanding as of December 31, 2015. Additional paid-in capital Retained earnings Accumulated other comprehensive loss Total stockholders' equity Total liabilities and stockholders' equity December 31, December 31, 2016 2015 $ 250,470 $ 129,852 622,685 433,638 917,491 783,031 174,507 152,242 1,965,153 1,498,763 804,211 538,531 563,591 585,181 64,310 75,686 136,862 92,157 110,204 75,652 $3,644,331 $2,865,970 $ 409,679 $ 200,460 208,750 192,935 27,000 42,000 40,387 43,415 685,816 478,810 790,388 624,070 137,227 94,868 1,613,431 1,197,748 61 61 11 11 73 72 823,484 636,558 1,259,414 1,076,533 (52,143) (45,013) 2,030,900 1,668,222 $3,644,331 $2,865,970 Under Armour, Inc. and Subsidiaries Consolidated Statements of Income (In thousands, except per share amounts) Year Ended December 31, 2016 2015 2014 $4,825,335 $3,963,313 $3,084,370 2,584,724 2,057,766 1,572,164 2,240,611 1,905,547 1,512,206 1,823,140 1,497,000 1,158,251 417,471 408,547 353,955 (26,434) (14,628) (2,755) (7,234) 388,282 386,685 131,303 154,112 256,979 232,573 59,000 197,979 232,573 Net revenues Cost of goods sold Gross profit Selling, general and administrative expenses Income from operations Interest expense, net Other expense, net Income before income taxes Provision for income taxes Net income. Adjustment payment to Class C capital stockholders Net income available to all stockholders $ $ $ Basic net income per share of Class A and B common stock Basic net income per share of Class C common stock Diluted net income per share of Class A and B common stock Diluted net income per share of Class C common stock Weighted average common shares outstanding Class A and B common stock Basic Diluted Weighted average common shares outstanding Class C common stock Basic Diluted (5,335) (6,410) 342,210 134,168 208,042 208,042 0.49 0.49 0.47 0.47 217,707 215,498 213,227 221,944 220,868 219,380 218,623 215,498 213,227 222,904 220,868 219,380 0.45 $ 0.72 $ 0.45 $ 0.71 $ 0.54 $ 0.54 $ 0.53 $ 0.53 $ Net Revenues Cost of Goods Sold -Gross Profit Sell, Gen & Admin Exp -Operating Income Interest Expense Other Expense -Income before taxes Income Taxes -Net Income Under Armour Inc. Horizontal Analysis - Income Statement 2014 2015 % Change 3,084,370 3,963,313 28.5% 1,572,164 2,057,766 30.9% 1,512,206 1,905,547 26.0% 1,158,251 1,497,000 29.2% 353,955 408,547 15.4% -5,335 -14,628 174.2% -6,410 -7,234 12.9% 342,210 386,685 13.0% 134,168 154,112 14.9% 208,042 232,573 0.1179137 2016 % Change 21.8% 4,825,335 2,584,724 25.6% 2,240,611 17.6% 1,823,140 21.8% 417,471 2.2% -26,434 80.7% -2,755 -61.9% 388,282 0.4% 131,303 -14.8% 256,979 0.1049391 Under Armour Inc. Horizontal Analysis - Balance Sheet 2015 Assets Cash & Equivalents Accounts Receivable Inventories Prepaid Expense & Other Total Current Assets Property & Equipment Goodwill Intangible Assets Deferred Income Taxes Other Long Term Assets Total Assets Liabilities and Stockholders' Equity Accounts Payable Accrued Expenses Current Maturities of long term debt Other Current Liabilities Total Current Liabilities Long Term Debt, Net of Current Maturities Other Long Term Liabilities Total Liabilities Class A Common Stock Class B Convertible Common Stock Class C Common Stock Additional Paid-In Capital Retained Earnings Accumulated Other Compensation Loss Total Stockholders' Equity Total Liabilities and Stockholders' Equity 2016 129,852 250,470 433,638 783,031 152,242 1,498,763 538,531 585,181 75,686 92,157 75,652 2,865,970 200,460 192,935 42,000 43,415 478,810 624,070 94,868 1,197,748 61 11 72 636,558 1,076,533 -45,013 1,668,222 2,865,970 622,685 917,491 174,507 1,965,153 804,211 563,591 64,310 136,862 110,204 3,644,331 409,679 208,750 27,000 40,387 685,816 790,388 137,227 1,613,431 61 11 73 823,484 1,259,414 -52,143 2,030,900 3,644,331 % Change. 92.9% 43.6% 17.2% 14.6% 31.1% 49.3% -3.7% -15.0% 48.5% 45.7% 27.2% 104.4% 8.2% -35.7% -7.0% 43.2% 26.7% 44.7% 34.7% 0.0% 0.0% 1.4% 29.4% 17.0% 15.8% 21.7% 27.2% 2016 Under Armour Inc. Ratio Analysis 2015 Liquidity Ratios Current Ratio 3.13 Quick Ratio 1.49 Cash Flow Liquidity Ratio 3.76 2.87 1.27 3.33 Activity Ratios Acct Receivable Turnover Days Sales Outstanding Inventory Turnover Acct Payable Turnover Days Payable Outstanding 8.82 41 2.63 10.27 36 7.46 49 2.82 6.31 58 Leverage Ratios Debt Ratio Debt to Equity Times Interest Earned 0.42 0.72 -27.93 0.44 0.79 - 15.79 Profitablity Ratios Gross Profit Margin Operating Profit Margin Net Profit Margin Cash Flow Margin Return on Total Assets Return on Equity 0.50 0.11 60.90 3.92 0.08 0.01 0.48 0.09 42.61 78.99 0.05 0.01 Market Ratios Earning per Share Price to Earnings Ratio Dividend Yield 0.53 98.21 0 0.44 60.62 0
Step by Step Solution
There are 3 Steps involved in it

Get step-by-step solutions from verified subject matter experts