

Question: Please write and post the Matlab code for this question. weight feed 1 179 horsebean 2 160 horsebean 3 136 horsebean 4 227 horsebean 5
Please write and post the Matlab code for this question.
| weight | feed | |
| 1 | 179 | horsebean |
| 2 | 160 | horsebean |
| 3 | 136 | horsebean |
| 4 | 227 | horsebean |
| 5 | 217 | horsebean |
| 6 | 168 | horsebean |
| 7 | 108 | horsebean |
| 8 | 124 | horsebean |
| 9 | 143 | horsebean |
| 10 | 140 | horsebean |
| 11 | 309 | linseed |
| 12 | 229 | linseed |
| 13 | 181 | linseed |
| 14 | 141 | linseed |
| 15 | 260 | linseed |
| 16 | 203 | linseed |
| 17 | 148 | linseed |
| 18 | 169 | linseed |
| 19 | 213 | linseed |
| 20 | 257 | linseed |
| 21 | 244 | linseed |
| 22 | 271 | linseed |
| 23 | 243 | soybean |
| 24 | 230 | soybean |
| 25 | 248 | soybean |
| 26 | 327 | soybean |
| 27 | 329 | soybean |
| 28 | 250 | soybean |
| 29 | 193 | soybean |
| 30 | 271 | soybean |
| 31 | 316 | soybean |
| 32 | 267 | soybean |
| 33 | 199 | soybean |
| 34 | 171 | soybean |
| 35 | 158 | soybean |
| 36 | 248 | soybean |
| 37 | 423 | sunflower |
| 38 | 340 | sunflower |
| 39 | 392 | sunflower |
| 40 | 339 | sunflower |
| 41 | 341 | sunflower |
| 42 | 226 | sunflower |
| 43 | 320 | sunflower |
| 44 | 295 | sunflower |
| 45 | 334 | sunflower |
| 46 | 322 | sunflower |
| 47 | 297 | sunflower |
| 48 | 318 | sunflower |
| 49 | 325 | meatmeal |
| 50 | 257 | meatmeal |
| 51 | 303 | meatmeal |
| 52 | 315 | meatmeal |
| 53 | 380 | meatmeal |
| 54 | 153 | meatmeal |
| 55 | 263 | meatmeal |
| 56 | 242 | meatmeal |
| 57 | 206 | meatmeal |
| 58 | 344 | meatmeal |
| 59 | 258 | meatmeal |
| 60 | 368 | casein |
| 61 | 390 | casein |
| 62 | 379 | casein |
| 63 | 260 | casein |
| 64 | 404 | casein |
| 65 | 318 | casein |
| 66 | 352 | casein |
| 67 | 359 | casein |
| 68 | 216 | casein |
| 69 | 222 | casein |
| 70 | 283 | casein |
| 71 | 332 | casein |
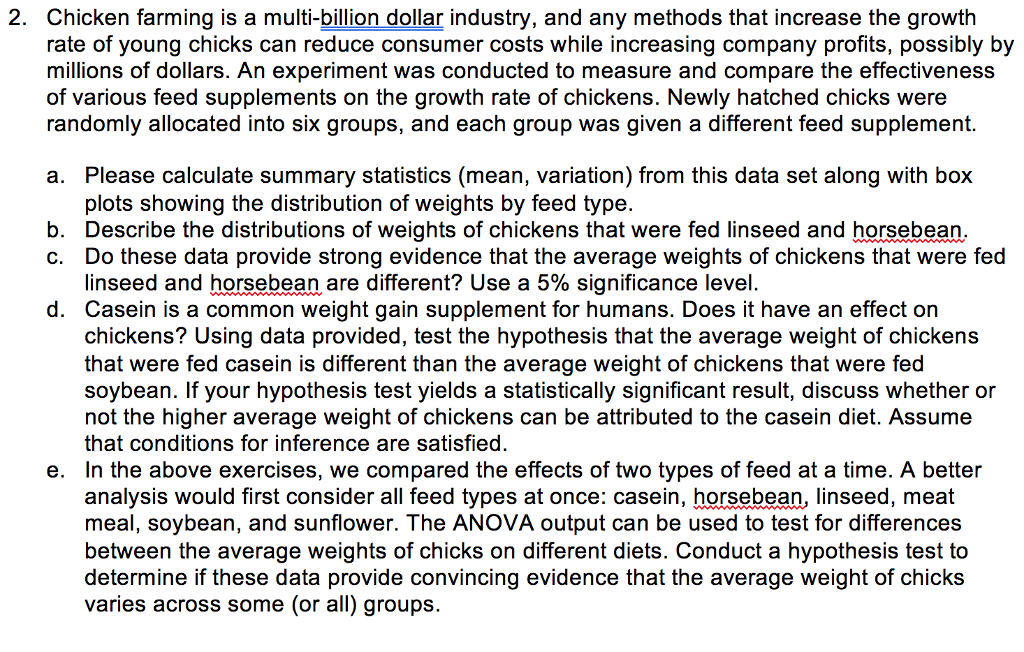
2. Chicken farming is a multi-billion dollar industry, and any methods that increase the growth rate of young chicks can reduce consumer costs while increasing company profits, possibly by millions of dollars. An experiment was conducted to measure and compare the effectiveness of various feed supplements on the growth rate of chickens. Newly hatched chicks were randomly allocated into six groups, and each group was given a different feed supplement. a. Please calculate summary statistics (mean, variation) from this data set along with box plots showing the distribution of weights by feed type b. Describe the distributions of weights of chickens that were fed linseed and horsebean c. Do these data provide strong evidence that the average weights of chickens that were fed linseed and horsebean are different? Use a 5% significance level d. Casein is a common weight gain supplement for humans. Does it have an effect on chickens? Using data provided, test the hypothesis that the average weight of chickens that were fed casein is different than the average weight of chickens that were fed soybean. If your hypothesis test yields a statistically significant result, discuss whether or not the higher average Weight of chickens can be attributed to the casein diet. Assume that conditions for inference are satisfied e. In the above exercises, we compared the effects of two types of feed at a time. A better analysis would first consider all feed types at once: casein, horsebean, linseed, meat meal, soybean, and sunflower. The ANOVA output can be used to test for differences between the average weights of chicks on different diets. Conduct a hypothesis test to determine if these data provide convincing evidence that the average weight of chicks varies across some (or all) groups 2. Chicken farming is a multi-billion dollar industry, and any methods that increase the growth rate of young chicks can reduce consumer costs while increasing company profits, possibly by millions of dollars. An experiment was conducted to measure and compare the effectiveness of various feed supplements on the growth rate of chickens. Newly hatched chicks were randomly allocated into six groups, and each group was given a different feed supplement. a. Please calculate summary statistics (mean, variation) from this data set along with box plots showing the distribution of weights by feed type b. Describe the distributions of weights of chickens that were fed linseed and horsebean c. Do these data provide strong evidence that the average weights of chickens that were fed linseed and horsebean are different? Use a 5% significance level d. Casein is a common weight gain supplement for humans. Does it have an effect on chickens? Using data provided, test the hypothesis that the average weight of chickens that were fed casein is different than the average weight of chickens that were fed soybean. If your hypothesis test yields a statistically significant result, discuss whether or not the higher average Weight of chickens can be attributed to the casein diet. Assume that conditions for inference are satisfied e. In the above exercises, we compared the effects of two types of feed at a time. A better analysis would first consider all feed types at once: casein, horsebean, linseed, meat meal, soybean, and sunflower. The ANOVA output can be used to test for differences between the average weights of chicks on different diets. Conduct a hypothesis test to determine if these data provide convincing evidence that the average weight of chicks varies across some (or all) groups
Step by Step Solution
There are 3 Steps involved in it

Get step-by-step solutions from verified subject matter experts