

Question: Please write and write up comparing and contrasting the financial analysis of the companies JCPenney and Kohls. I will post the statements below. Please include:
Please write and write up comparing and contrasting the financial analysis of the companies JCPenney and Kohls. I will post the statements below. Please include:
Sales growth in terms of percentage of increase and the numbers of stores. If you are reading the annual report, are either of the two companies adding product lines?
Look at profitability treads for gross profit, operating profit, and net income. How is the profitability changing between the two companies?
Since these are large retail stores, what is the trend in inventory growth? Are the growing the inventory are can the accommodate the sales increases with about the current amount of inventory on hand? Please compare their inventory efficiency with the inventory turnover ratios for each company.
How are the companies handling their long-term debt? What have been the debt to equity ratios in the last five years? Can you tell what has been acquired with the additional debt, if there is any?
Lastly, lets see what the stock market thinks of each companys performance. In what range has their share price been trading in the last five years? How has the Price to Earnings (P/E) ratio been during that time?
What has taken place with each of these companies since the Annual Statement date? Search for new releases and other business articles and publications about each company.
Please follow this format:
Sales Growth Are Net Sales Growing? Are there any divisions or product lines growing? Does the annual report indicate the reason(s) for this? Does your directional analysis (horizontal or vertical) bear this out? Can we see the sales increase in the inventory turnover ratio?
Cost Control are expenses in line with the change in net sales? Look at the costs, including the cost of goods sold, marketing expenses, and administrative expenses. Look at the COGS% change and the SGA% (selling, general & administrative expenses) changes. Again, support your observation with your directional analysis and/or ratios, Profitability Look at the three levels of profits: gross margin, operating profit, and net income. How are they changing from year to year as a percentage of sales (vertical analysis)?
Cash Flow and Liquidity - Is cash increasing or decreasing. Does that make sense in light of the profits? What about the liquidity ratios? Did you find a change in the current or the quick ratio? Look at the cash flow statements. Are operations generating or consuming cash? Is the growth of inventory reasonable as compared to the growth in cost of goods sold? Look at the accounts payable turnover ratio. And dont forget about accounts receivable and their change. Are you concerned with changes in the accounts receivable turnover ratio? Debt Levels Is debt increasing or decreasing? Looks at the change in current and long-term liabilities in your directional analyses. What are the reasons for this change? Look at your debt ratios. Is there anything in the annual report or outside articles to explain a significant change in debt, if you find one?
Equity and Stock Market Factors Has common stock plus the paid-in capital on common stock increased? Has it decreased from a buyback of common stock (treasury stock)? What about the price of the stock, has it changed significantly over the years of your analysis. Look at the price to earnings ratio and the dividend yield ratio.
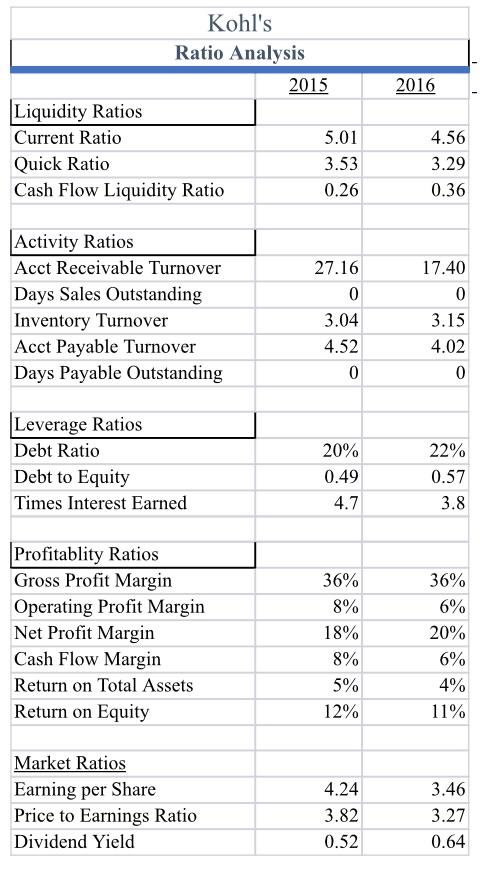
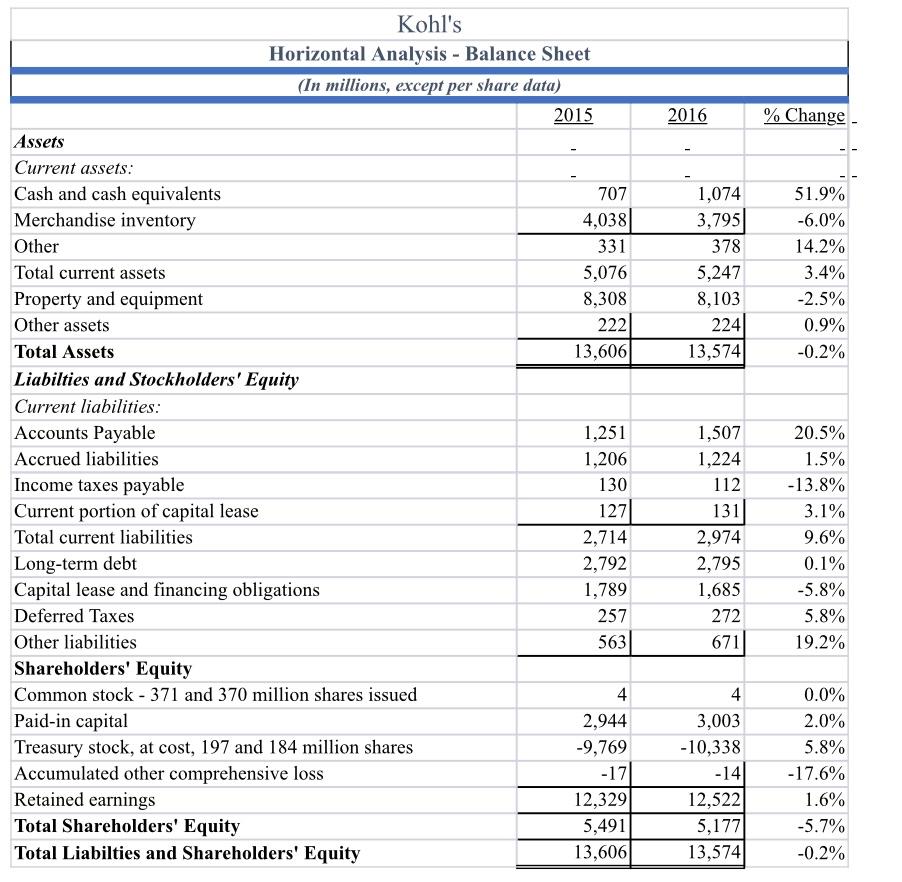
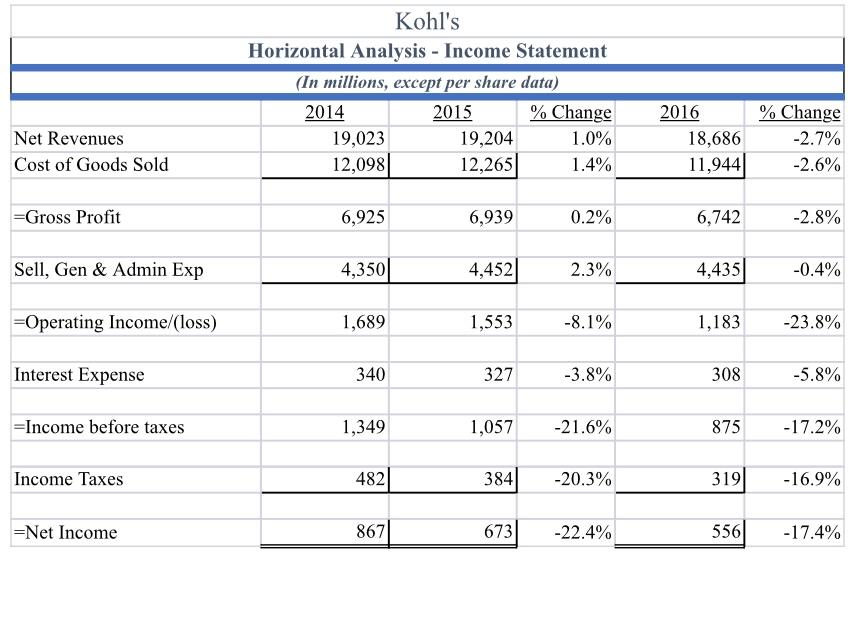
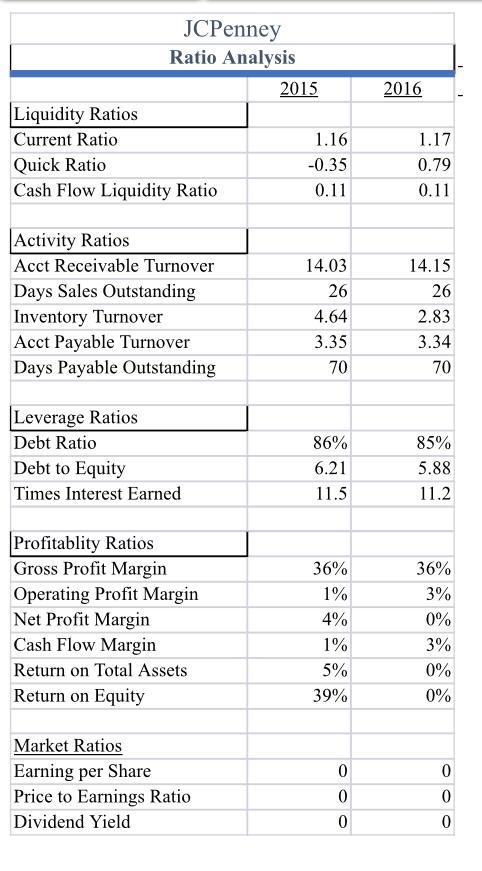
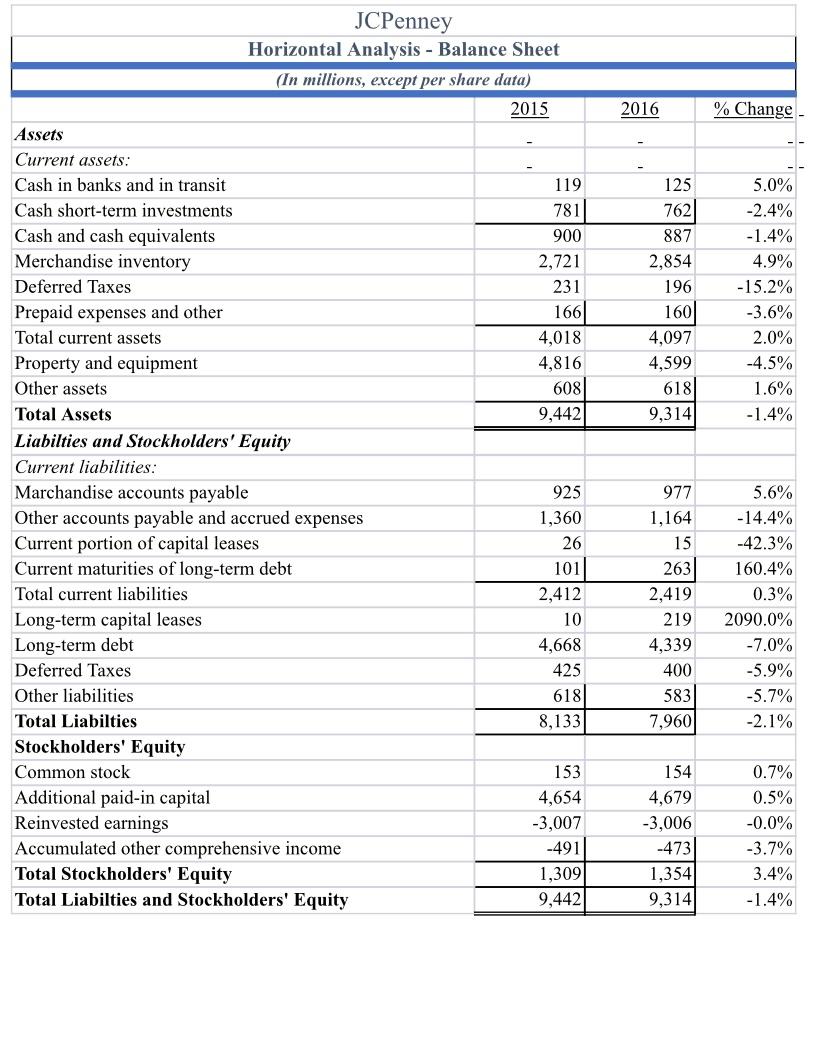
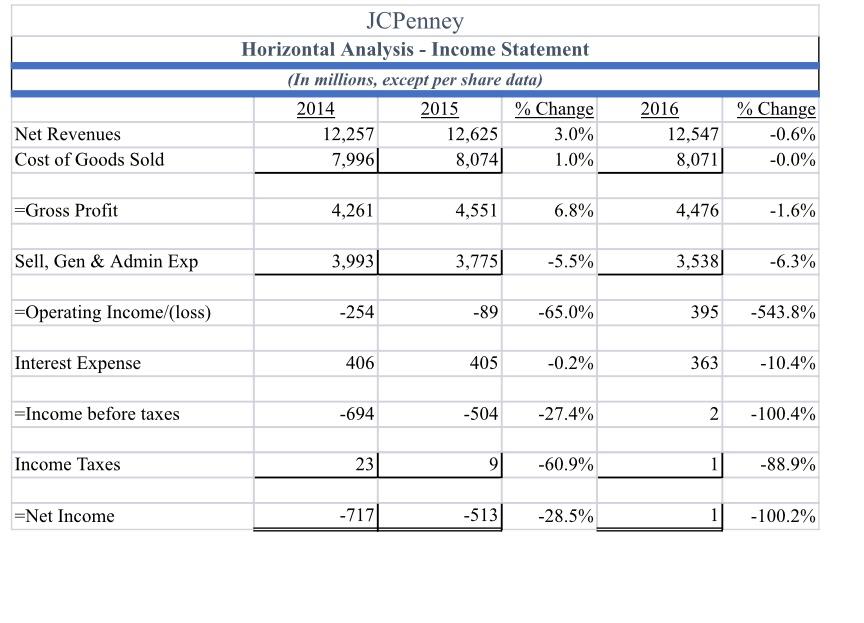
Kohl's Ratio Analysis Liquidity Ratios Current Ratio Quick Ratio Cash Flow Liquidity Ratio Activity Ratios Acct Receivable Turnover Days Sales Outstanding Inventory Turnover Acct Payable Turnover Days Payable Outstanding Leverage Ratios Debt Ratio Debt to Equity Times Interest Earned Profitablity Ratios Gross Profit Margin Operating Profit Margin Net Profit Margin Cash Flow Margin Return on Total Assets Return on Equity Market Ratios Earning per Share Price to Earnings Ratio Dividend Yield 2015 5.01 3.53 0.26 27.16 0 3.04 4.52 0 20% 0.49 4.7 36% 8% 18% 8% 5% 12% 4.24 3.82 0.52 2016 4.56 3.29 0.36 17.40 0 3.15 4.02 0 22% 0.57 3.8 36% 6% 20% 6% 4% 11% 3.46 3.27 0.64 Kohl's Horizontal Analysis - Balance Sheet (In millions, except per share data) 2015 Assets Current assets: Cash and cash equivalents Merchandise inventory Other Total current assets Property and equipment Other assets Total Assets Liabilties and Stockholders' Equity Current liabilities: Accounts Payable Accrued liabilities Income taxes payable Current portion of capital lease Total current liabilities Long-term debt Capital lease and financing obligations Deferred Taxes Other liabilities Shareholders' Equity Common stock - 371 and 370 million shares issued Paid-in capital Treasury stock, at cost, 197 and 184 million shares Accumulated other comprehensive loss Retained earnings Total Shareholders' Equity Total Liabilties and Shareholders' Equity 707 4,038 331 5,076 8,308 222 13,606 1,251 1,206 130 127 2,714 2,792 1,789 257 563 4 2,944 -9,769 -17 12,329 5,491 13,606 2016 1,074 3,795 378 5,247 8,103 224 13,574 1,507 1,224 112 131 2,974 2,795 1,685 272 671 4 3,003 -10,338 -14 12,522 5,177 13,574 % Change 51.9% -6.0% 14.2% 3.4% -2.5% 0.9% -0.2% 20.5% 1.5% -13.8% 3.1% 9.6% 0.1% -5.8% 5.8% 19.2% 0.0% 2.0% 5.8% -17.6% 1.6% -5.7% -0.2% Net Revenues Cost of Goods Sold -Gross Profit Sell, Gen & Admin Exp -Operating Income/(loss) Interest Expense -Income before taxes Income Taxes -Net Income Kohl's Horizontal Analysis - Income Statement (In millions, except per share data) 2014 2015 % Change 19,023 19,204 1.0% 12,098 12,265 1.4% 6,925 6,939 0.2% 4,350 4,452 2.3% 1,689 1,553 -8.1% 340 327 -3.8% 1,349 1,057 -21.6% 482 384 -20.3% 867 673 -22.4% 2016 18,686 11,944 6,742 4,435 1,183 308 875 319 556 % Change -2.7% -2.6% -2.8% -0.4% -23.8% -5.8% -17.2% -16.9% -17.4% JCPenney Ratio Analysis Liquidity Ratios Current Ratio Quick Ratio Cash Flow Liquidity Ratio Activity Ratios Acct Receivable Turnover Days Sales Outstanding Inventory Turnover Acct Payable Turnover Days Payable Outstanding Leverage Ratios Debt Ratio Debt to Equity Times Interest Earned Profitablity Ratios Gross Profit Margin Operating Profit Margin Net Profit Margin Cash Flow Margin Return on Total Assets Return on Equity Market Ratios Earning per Share Price to Earnings Ratio Dividend Yield 2015 1.16 -0.35 0.11 14.03 26 4.64 3.35 70 86% 6.21 11.5 36% 1% 4% 1% 5% 39% 0 0 0 2016 1.17 0.79 0.11 14.15 26 2.83 3.34 70 85% 5.88 11.2 36% 3% 0% 3% 0% 0% 0 0 0 JCPenney Horizontal Analysis - Balance Sheet (In millions, except per share data) 2015 Assets Current assets: Cash in banks and in transit Cash short-term investments Cash and cash equivalents Merchandise inventory Deferred Taxes Prepaid expenses and other Total current assets Property and equipment Other assets Total Assets Liabilties and Stockholders' Equity Current liabilities: Marchandise accounts payable Other accounts payable and accrued expenses Current portion of capital leases Current maturities of long-term debt Total current liabilities Long-term capital leases Long-term debt Deferred Taxes Other liabilities Total Liabilties Stockholders' Equity Common stock Additional paid-in capital Reinvested earnings Accumulated other comprehensive income Total Stockholders' Equity Total Liabilties and Stockholders' Equity 119 781 900 2,721 231 166 4,018 4,816 608 9,442 925 1,360 26 101 2,412 10 4,668 425 618 8,133 153 4,654 -3,007 -491 1,309 9,442 2016 125 762 887 2,854 196 160 4,097 4,599 618 9,314 977 1,164 15 263 2,419 219 4,339 400 583 7,960 154 4,679 -3,006 -473 1,354 9,314 % Change_ 5.0% -2.4% -1.4% 4.9% -15.2% -3.6% 2.0% -4.5% 1.6% -1.4% 5.6% -14.4% -42.3% 160.4% 0.3% 2090.0% -7.0% -5.9% -5.7% -2.1% 0.7% 0.5% -0.0% -3.7% 3.4% -1.4% Net Revenues Cost of Goods Sold -Gross Profit Sell, Gen & Admin Exp -Operating Income/(loss) Interest Expense -Income before taxes Income Taxes -Net Income JCPenney Horizontal Analysis - Income Statement (In millions, except per share data) 2014 2015 % Change 12,257 12,625 3.0% 7,996 8,074 1.0% 4,261 4,551 6.8% 3,993 3,775 -5.5% -254 -89 -65.0% 406 405 -0.2% -694 -504 -27.4% 23 9 -60.9% -717 -513 -28.5% 2016 12,547 8,071 4,476 3,538 395 363 2 1 1 % Change -0.6% -0.0% -1.6% -6.3% -543.8% -10.4% -100.4% -88.9% -100.2%
Step by Step Solution
There are 3 Steps involved in it

Get step-by-step solutions from verified subject matter experts