

Question: Please Write legible Data from a 20-yr study show the number of new AIDS cases diagnosed among 20- to 24-yr-olds in the United States CC
Please Write legible
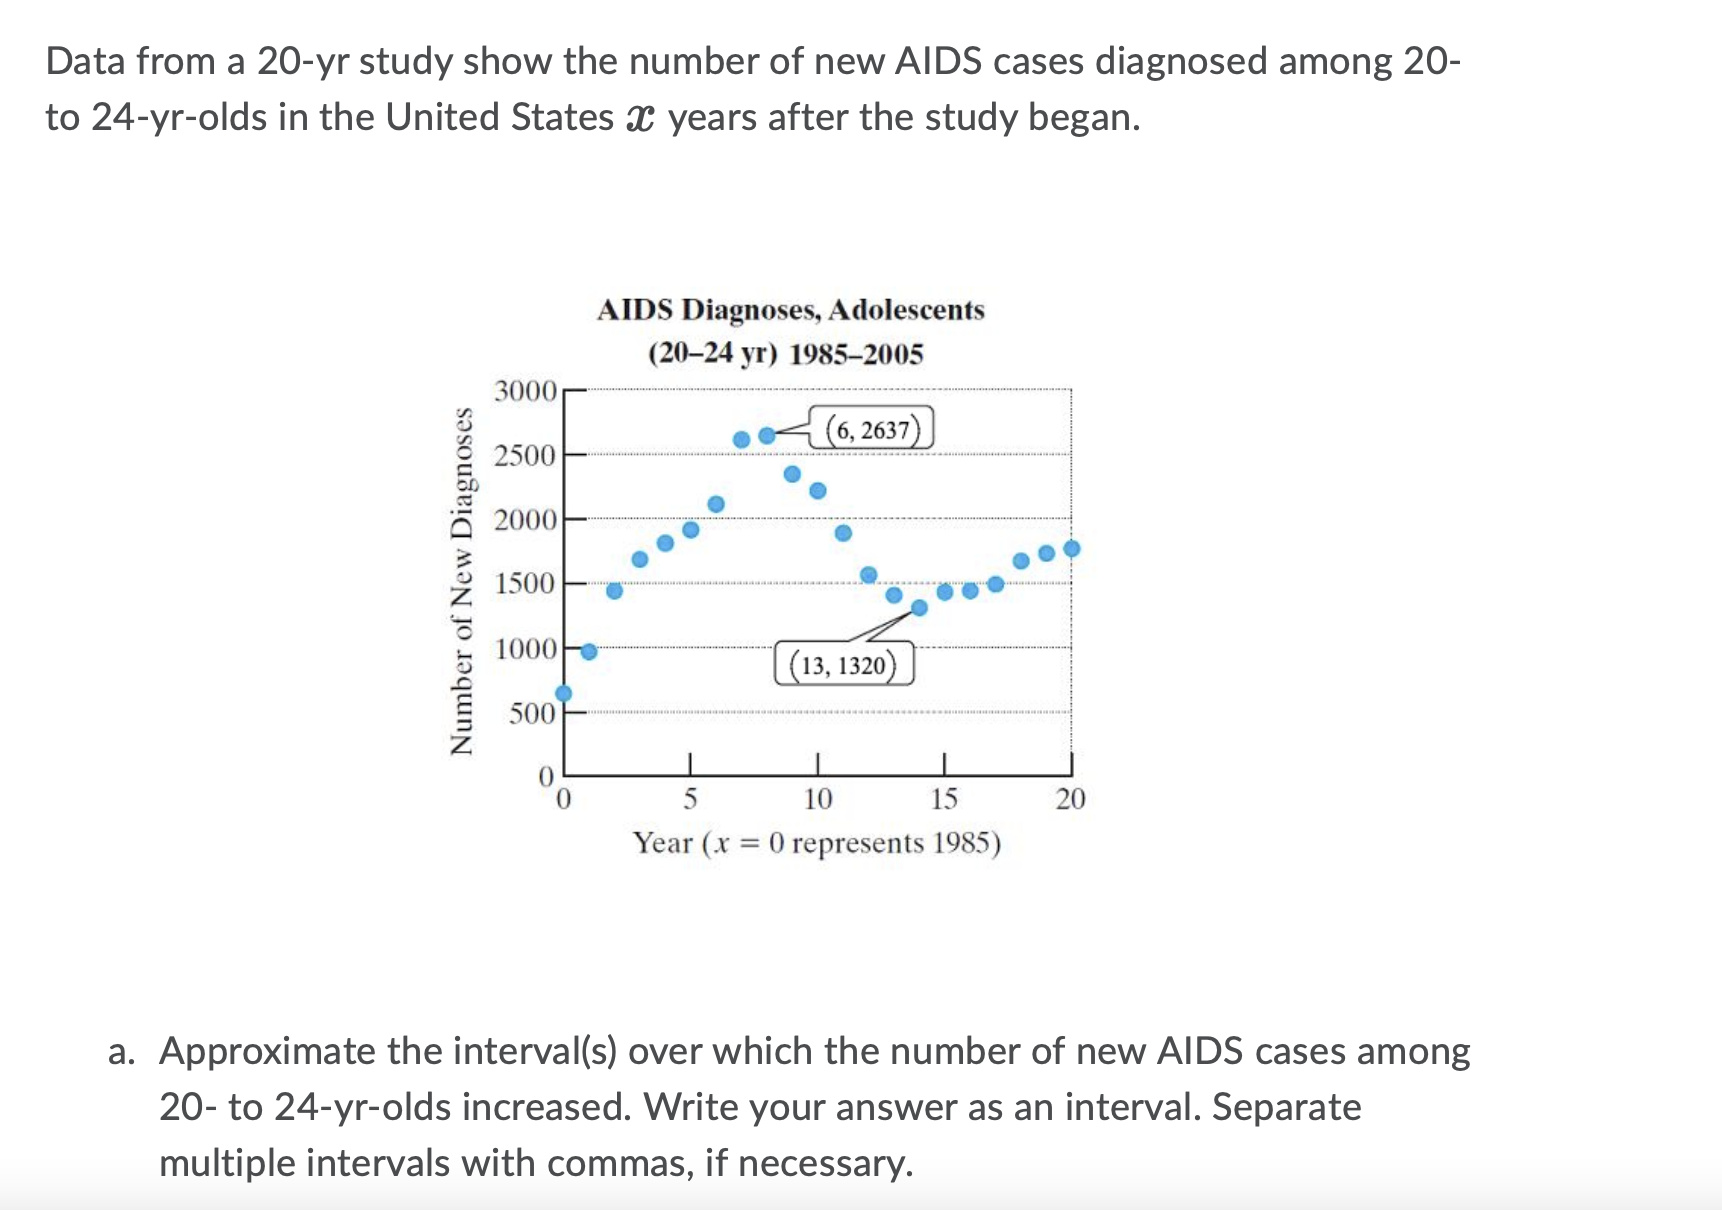


Data from a 20-yr study show the number of new AIDS cases diagnosed among 20- to 24-yr-olds in the United States CC years after the study began. AIDS Diagnoses, Adolescents (2024 )1) 19852005 Number of New Diagnoses 0 5 10 15 20 Year (x = 0 represents 1985) a. Approximate the interva|(s) over which the number of new AIDS cases among 20- to 24-yr-olds increased. Write your answer as an interval. Separate multiple intervals with commas, if necessary. The number of new AIDS cases among adolescents 20-24 yr increased over b. Approximate the interva|(s) over which the number of new AIDS cases among 20- to 24-yr-olds decreased. Write your answer as an interval. Separate multiple intervals with commas, if necessary. The number of new AIDS cases among adolescents 20-24 yr decreased over Question 2 (1 point) Explain why an exponential or logarithmic function would not be used to model the graph from question 1 For Question 1, what is the y intercept and explain the meaning in the context of that
Step by Step Solution
There are 3 Steps involved in it

Get step-by-step solutions from verified subject matter experts