

Question: please write out and explain steps, I am actually trying to lesrn this subject and its really hard for me. Im not looking to chest
please write out and explain steps, I am actually trying to lesrn this subject and its really hard for me. Im not looking to chest or just answers 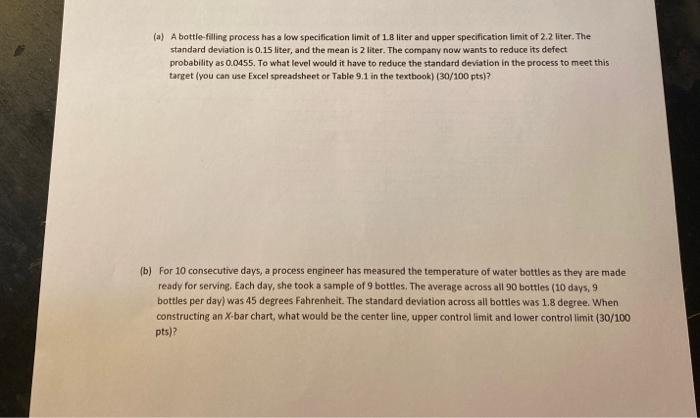
(a) A bottle-filling process has a low specification limit of 1.8 liter and upper specification limit of 2.2 liter. The standard deviation is 0.15 liter, and the mean is 2 liter. The company now wants to reduce its defect probability as 0.0455. To what level would it have to reduce the standard deviation in the process to meet this target (you can use Excel spreadsheet or Table 9.1 in the textbook) (30/100pts)? (b) For 10 consecutive days, a process engineer has measured the temperature of water bottles as they are made ready for serving. Each day, she took a sample of 9 bottles. The average across all 90 bottles (10 days, 9 bottles per day) was 45 degrees Fahrenheit. The standard deviation across all bottles was 1.8 degree. When constructing an X-bar chart, what would be the center line, upper controllimit and lower controllimit (30/100 pts) Step by Step Solution
There are 3 Steps involved in it
1 Expert Approved Answer
Step: 1 Unlock

Question Has Been Solved by an Expert!
Get step-by-step solutions from verified subject matter experts
Step: 2 Unlock
Step: 3 Unlock