

Question: Please write project412: your last name in the subject area. Part I. 1. (10 MARKS) Consider American call options written on S&P 500 etf
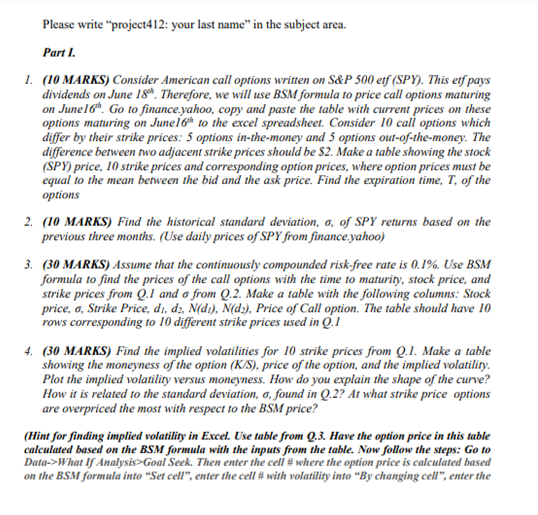
Please write "project412: your last name" in the subject area. Part I. 1. (10 MARKS) Consider American call options written on S&P 500 etf (SPY). This etf pays dividends on June 18th. Therefore, we will use BSM formula to price call options maturing on June 16th. Go to finance.yahoo, copy and paste the table with current prices on these options maturing on June 16th to the excel spreadsheet. Consider 10 call options which differ by their strike prices: 5 options in-the-money and 5 options out-of-the-money. The difference between two adjacent strike prices should be $2. Make a table showing the stock (SPY) price, 10 strike prices and corresponding option prices, where option prices must be equal to the mean between the bid and the ask price. Find the expiration time, T, of the options 2. (10 MARKS) Find the historical standard deviation, o, of SPY returns based on the previous three months. (Use daily prices of SPY from finance.yahoo) 3. (30 MARKS) Assume that the continuously compounded risk-free rate is 0.1%. Use BSM formula to find the prices of the call options with the time to maturity, stock price, and strike prices from Q.1 and a from Q.2. Make a table with the following columns: Stock price, o, Strike Price, di, dz, N(di), N(d2), Price of Call option. The table should have 10 rows corresponding to 10 different strike prices used in Q.1 4. (30 MARKS) Find the implied volatilities for 10 strike prices from Q.1. Make a table showing the moneyness of the option (K/S), price of the option, and the implied volatility. Plot the implied volatility versus moneyness. How do you explain the shape of the curve? How it is related to the standard deviation, o, found in Q.2? At what strike price options are overpriced the most with respect to the BSM price? (Hint for finding implied volatility in Excel. Use table from Q.3. Have the option price in this table calculated based on the BSM formula with the inputs from the table. Now follow the steps: Go to Data->What If Analysis>Goal Seek. Then enter the cell # where the option price is calculated based on the BSM formula into "Set cell", enter the cell # with volatility into "By changing cell", enter the
Step by Step Solution
There are 3 Steps involved in it
To address this question in detail with calculations Ill outline the stepbystep approach required to solve each part Heres a structured breakdown of how to approach each question Part 1 SPY Options Vo... View full answer

Get step-by-step solutions from verified subject matter experts