

Question: Please Write the SCRIPT please following these instructions the function is function [rangeLoss1way_db] = lastname_get_rangeLoss(freq_mhz, distance_km) rangeLoss1way_db = 32.4 + 20*log10(freq_mhz) + 20*log10(distance_km); end Show
Please Write the SCRIPT please following these instructions the function is
function [rangeLoss1way_db] = lastname_get_rangeLoss(freq_mhz, distance_km)
rangeLoss1way_db = 32.4 + 20*log10(freq_mhz) + 20*log10(distance_km);
end
Show that the MATLAB Code works. This is my 3RD Time posting this question. Please I want the code to make this work I already have the function. I would like the code, I would like a description of it, I would like what I asked for please.
![[rangeLoss1way_db] = lastname_get_rangeLoss(freq_mhz, distance_km) rangeLoss1way_db = 32.4 + 20*log10(freq_mhz) + 20*log10(distance_km); end](https://dsd5zvtm8ll6.cloudfront.net/si.experts.images/questions/2024/09/66f023520a939_71366f0235176cc5.jpg)
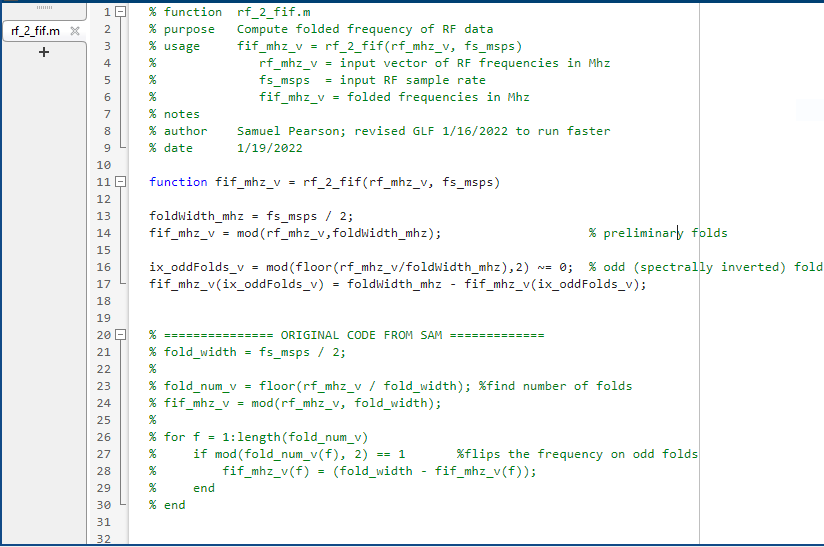
Modify the rf_2_if function as follows and submit to D2L: (download the code first) a. Rename to _get_rangeLoss.m b. Calculate the 1-way range loss in dB with interface as follows (use your name) [rangeLosslway_db] = fudge_get_rangeLoss (freq_mhz, distance_km) c. Input is carrier frequency in MHz and distance in km; output is 1-way range loss in dB d. Optional bonus: add 2nd output argument for 2-way range loss in dB Develop and submit to D2L a script (_demo_rangeLoss) as follows: a. Develop a stand-alone demo that demonstrates your range loss function b. You decide on how best to do the demo, but you should use at least two subplots - For typical homework with both function and demo script - 30 points: Function correctly computes desired function - 30 points: Demo correctly runs - "Correctly runs" includes using figure(figNum), figNum = figNum +1; clf - "Correctly runs" includes using plotPositionWide_v to set the plot position - 10 points: Demo and script are named correctly - 10 points: Code has appropriate header info and reasonable comments - Function input / output should be described in header - 10 points: x-axis, y-axis, title, legend all complete and accurate on demo plot(s) - 10 points: Demo figure is properly labeled using label_plotEdges - Demo name - If you load a data set, then name of data set (else use blank string ' ') - Student name - These are general guidelines - I will adapt to each assignment as necessary How I test your code: - I use a script that loops through the expected demo names - If my script crashes, I check which student's code caused it to crash - If figures are not good, I check which student didn't do their figures correctly - The script will crash if - Your demo is not named correctly - Your demo crashes - Anything your demo calls crashes - The plots may not be correct if - You forget to use figNum properly - This might cause another student's figure to be corrupted - You forget to clf before plotting - This might cause your figure to be corrupted if plotting on top of existing figure
Step by Step Solution
There are 3 Steps involved in it

Get step-by-step solutions from verified subject matter experts