

Question: Please write this in python Thank you. In this assignment, you will develop a simple graphical simulation that simulates a collection of cells that live
Please write this in python Thank you.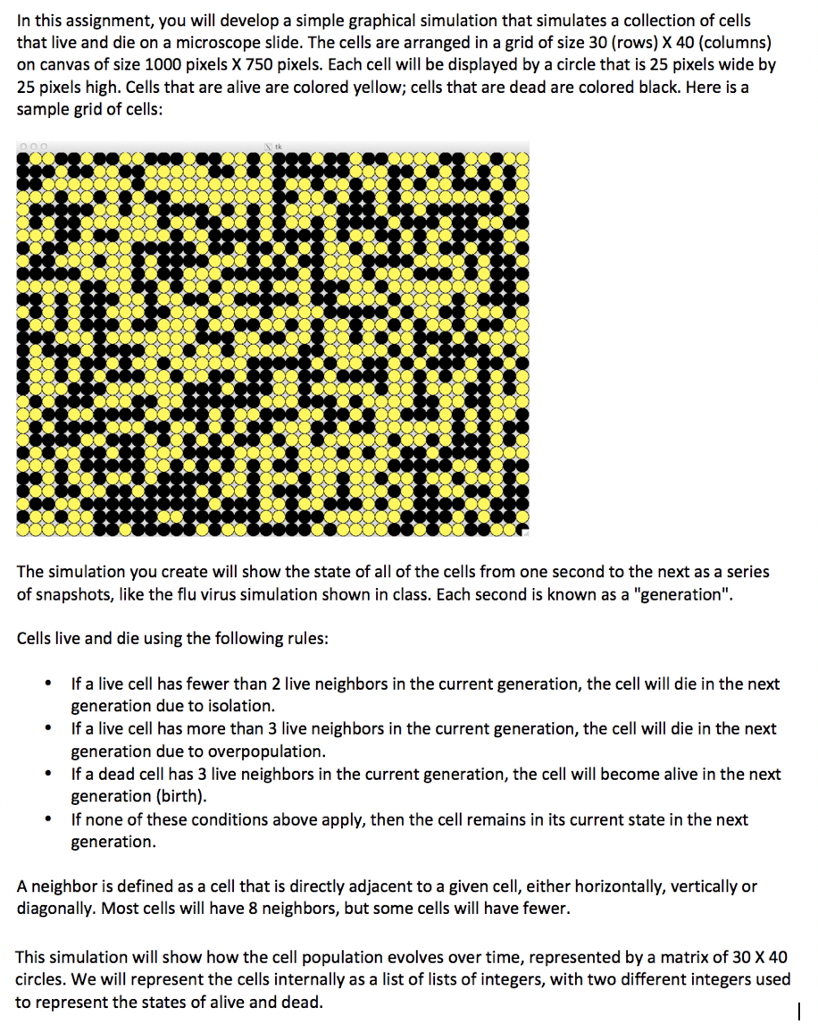
In this assignment, you will develop a simple graphical simulation that simulates a collection of cells that live and die on a microscope slide. The cells are arranged in a grid of size 30 (rows) X 40 (columns) on canvas of size 1000 pixels X 750 pixels. Each cell will be displayed by a circle that is 25 pixels wide by 25 pixels high. Cells that are alive are colored yellow; cells that are dead are colored black. Here is a sample grid of cells The simulation you create will show the state of all of the cells from one second to the next as a series of snapshots, like the flu virus simulation shown in class. Each second is known as a "generation". Cells live and die using the following rules If a live cell has fewer than 2 live neighbors in the current generation, the cell will die in the next If a live cell has more than 3 live neighbors in the current generation, the cell will die in the next If a dead cell has 3 live neighbors in the current generation, the cell will become alive in the next generation due to isolation generation due to overpopulation. generation (birth) If none of these conditions above apply, then the cell remains in its current state in the next generation A neighbor is defined as a cell that is directly adjacent to a given cell, either horizontally, vertically or diagonally. Most cells will have 8 neighbors, but some cells will have fewer. This simulation will show how the cell population evolves over time, represented by a matrix of 30 X 40 circles. We will represent the cells internally as a list of lists of integers, with two different integers used to represent the states of alive and dead In this assignment, you will develop a simple graphical simulation that simulates a collection of cells that live and die on a microscope slide. The cells are arranged in a grid of size 30 (rows) X 40 (columns) on canvas of size 1000 pixels X 750 pixels. Each cell will be displayed by a circle that is 25 pixels wide by 25 pixels high. Cells that are alive are colored yellow; cells that are dead are colored black. Here is a sample grid of cells The simulation you create will show the state of all of the cells from one second to the next as a series of snapshots, like the flu virus simulation shown in class. Each second is known as a "generation". Cells live and die using the following rules If a live cell has fewer than 2 live neighbors in the current generation, the cell will die in the next If a live cell has more than 3 live neighbors in the current generation, the cell will die in the next If a dead cell has 3 live neighbors in the current generation, the cell will become alive in the next generation due to isolation generation due to overpopulation. generation (birth) If none of these conditions above apply, then the cell remains in its current state in the next generation A neighbor is defined as a cell that is directly adjacent to a given cell, either horizontally, vertically or diagonally. Most cells will have 8 neighbors, but some cells will have fewer. This simulation will show how the cell population evolves over time, represented by a matrix of 30 X 40 circles. We will represent the cells internally as a list of lists of integers, with two different integers used to represent the states of alive and dead
Step by Step Solution
There are 3 Steps involved in it

Get step-by-step solutions from verified subject matter experts