

Question: please you can take a week to solvet or as soon as possiple dependes on your time. i make sure i give u a nice
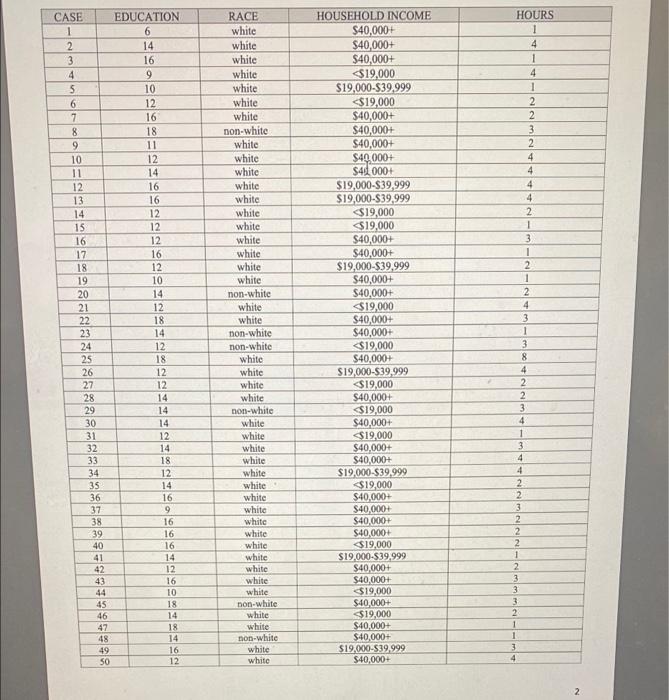

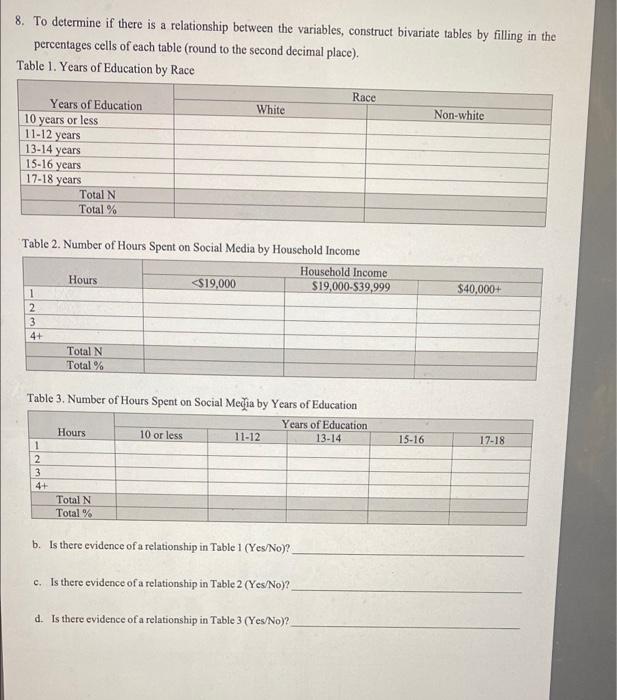
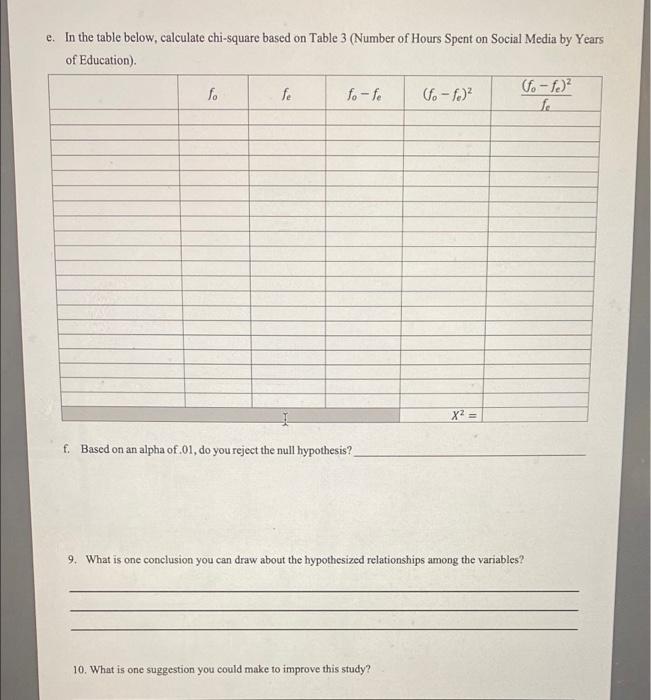
CASE 1 2 3 4 5 6 7 8 9 10 11 12 13 14 15 16 17 18 19 20 21 22 23 24 25 26 27 28 29 30 31 32 33 34 35 36 37 38 39 40 41 42 43 EDUCATION 6 14 16 9 10 12 16 18 11 12 14 16 16 12 12 12 16 12 10 14 12 18 14 12 18 12 12 14 14 14 12 14 18 12 14 16 9 16 16 16 14 12 16 10 18 14 18 14 16 12 RACE white white white white white white white non-white white white white white white white white white white white white non-white white white non-white non-white white white white white non-white white white white white white white white white white white white white white white white non-white white white non-white white white HOUSEHOLD INCOME $40,000+ $40,000+ $40,000+ $19,000 $19,000-$39.999 $19,000 $40,000+ $40,000+ S40,000+ $40,000+ $40.000+ $19,000-$39,999 $19,000-$39,999 $19,000 $19,000 $40,000+ $40,000+ $19,000-$39,999 $40,000+ $40,000+ $19,000 $40,000+ $40,000+ $19,000 $40,000+ $19,000-$39,999 $19,000 $40,000+ $19,000 $40,000+ $19,000 $40,000+ $40,000+ $19,000-$39,999 $19,000 $40,000+ $40,000+ $40,000+ $40,000+ $19,000 $19,000-$39.999 $40,000+ $40,000+ $19,000 $40,000+ $19,000 $40,000+ $40,000+ $19,000-$39.999 $40,000+ HOURS 1 4 1 4 1 2 2 3 2 4 4 4 4 2 1 3 1 2 1 2 4 3 1 3 8 4 2 2 3 4 1 3 4 4 2 2 3 2 2 2 1 2 3 3 3 2 1 1 8 100 ON 45 46 47 48 49 SO 4 2 Education: y = 13.70, S = 2.27 Hours Spent on Social Media: y = 2.60, S = 1.34 5. Now that you have descriptive information about the sample, determine how well the sample represents the population from which it was selected. The population size was 500 that the sample of 50 was drawn from. a. What would have happened if you had selected a different sample of 50 people? What would have changed? b. Will you be able to use the sample statistics to estimate the true population parameter? Why or why not? I c. Will you be able to use the sample statistics to state with 100% accuracy the actual population parameter? Why or why not? 6. Previously you computed the mean for the average number of years of education and the average number of hours spent on social media. Now use confidence intervals to estimate the actual education attainment and hours spent on social media for the population. a. Education Construct the 90% confidence interval: Interpret the 90% confidence interval. b. Hours Construct the 80% confidence interval: Construct the 95% confidence interval: Compare the 80% interval to the 95% interval 1 7. Test the following hypotheses 2. You know that the average number of years of education for the national population is 12.5 years, with a standard deviation of 1.5 years. You hypothesize that the sample's average number of years of education is different from the national population's average. What type of hypothesis test would this require, one-tailed or two-tailed? In proper notation, what would the null hypothesis be? In proper notation, what would the research hypothesis be? To test this hypothesis would you use a Zorat test? What is the test statistic (include degrees of freedom if necessary)? Assuming an alpha of .05, what is the p-or critical value needed to reject the null hypothesis? What is your conclusion? b. You know the average number of hours spend on social media per day for the population is 1, but don't know the standard deviation. You hypothesize that your sample spends more hours on social media per day than the national population What type of hypothesis test would this require, one-tailed or two-tailed? In proper notation, what would the null hypothesis be? In proper notation, what would the research hypothesis be? 1 To test this hypothesis would you use a Zor attest? What is the test statistic (include degrees of freedom if necessary)? Assuming an alpha of Os, what is the p-or critical value needed to reject the null hypothesis? What is your conclusion and interpretation? 8. To determine if there is a relationship between the variables, construct bivariate tables by filling in the percentages cells of each table (round to the second decimal place). Table 1. Years of Education by Race Race Years of Education White Non-white 10 years or less 11-12 years 13-14 years 15-16 years 17-18 years Total N Total % $40,000+ Table 2. Number of Hours Spent on Social Media by Household Income Household Income Hours
Step by Step Solution
There are 3 Steps involved in it

Get step-by-step solutions from verified subject matter experts