

Question: Please?At the end it also asks to fill inUpper Limit:Lower Limit: A consumer products testing group is evaluating two competing brands of tires, Brand 1
Please?At the end it also asks to fill inUpper Limit:Lower Limit:
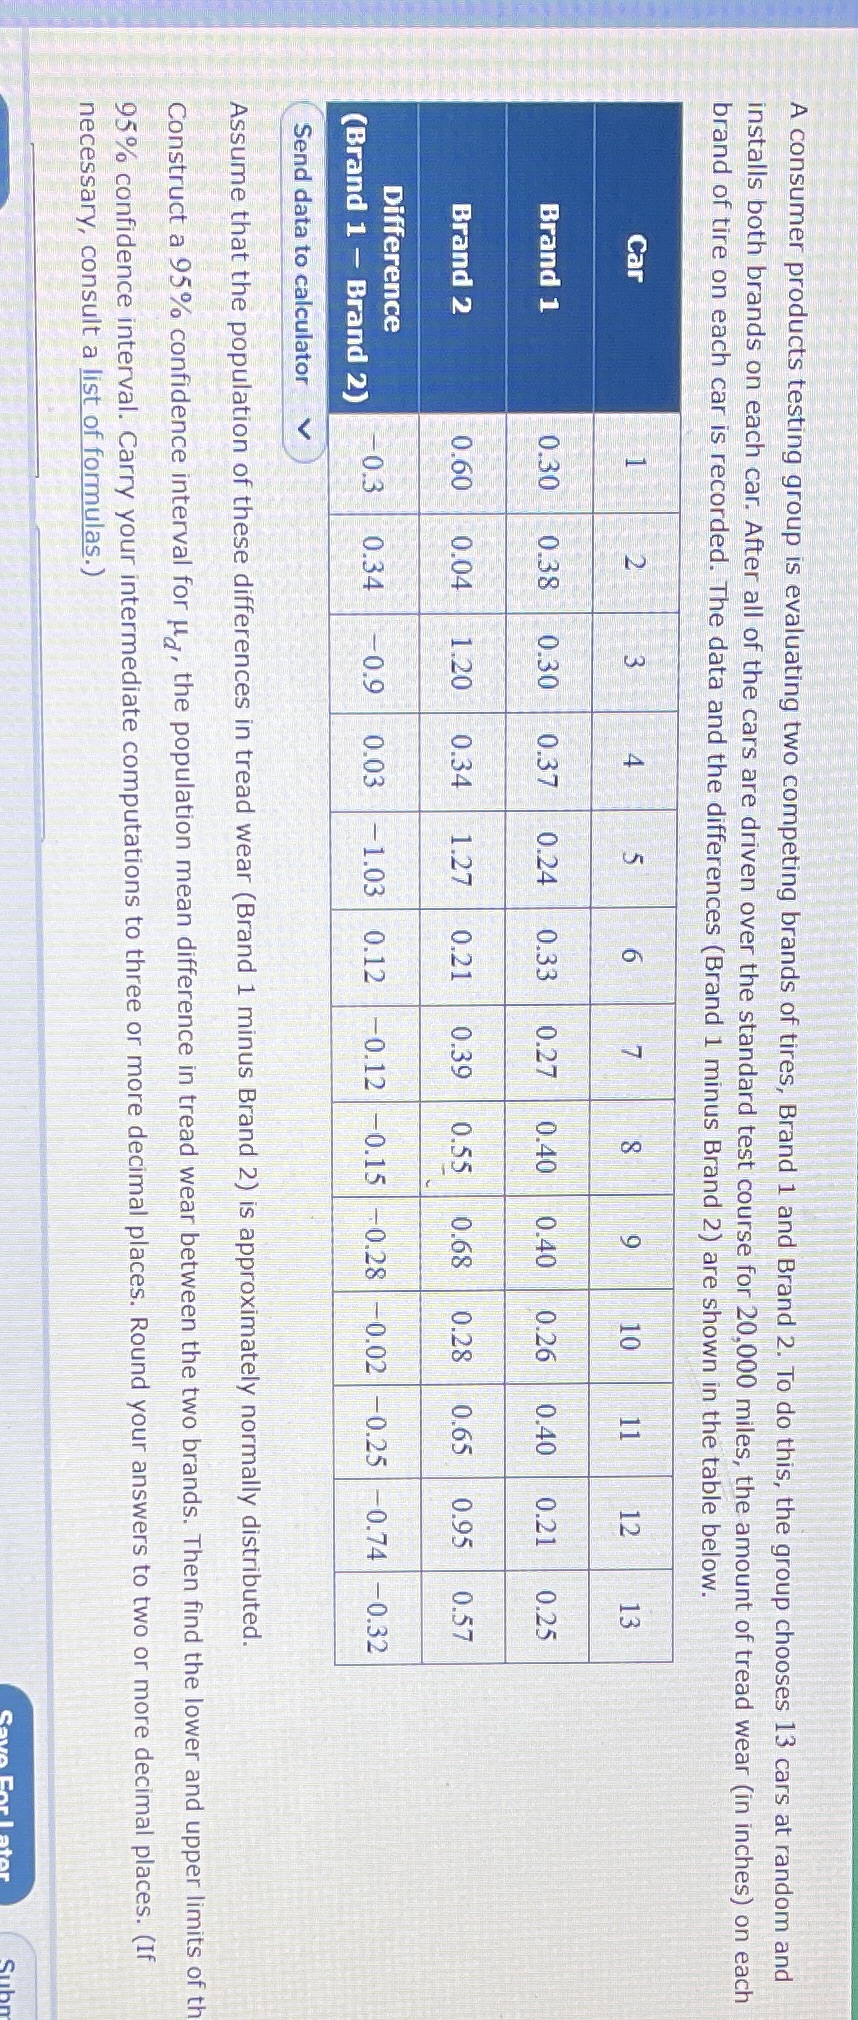
A consumer products testing group is evaluating two competing brands of tires, Brand 1 and Brand 2. To do this, the group chooses 13 cars at random and installs both brands on each car. After all of the cars are driven over the standard test course for 20,000 miles, the amount of tread wear (in inches) on each brand of tire on each car is recorded. The data and the differences (Brand 1 minus Brand 2) are shown in the table below. Car Brand 1 0.30 0.38 0.30 0.37 0.24 0.33 0.27 0.40 0.40 0.26 0.40 0.21 0.25 Brand 2 0.60 0.04 1.20 0.34 1.27 0.21 0.39 0.55 0.68 0.28 0.65 0.95 0.57 Difference (Brand 1 - Brand 2) 0.3 0.34 -0.9 0.03 - 1.03 0.12 -0.12 -0.15 -0.28 -0.02 -0.25 -0.74 -0.32 Send data to calculator V Assume that the population of these differences in tread wear (Brand 1 minus Brand 2) is approximately normally distributed. Construct a 95% confidence interval for u, the population mean difference in tread wear between the two brands. Then find the lower and upper limits of th 95% confidence interval. Carry your intermediate computations to three or more decimal places. Round your answers to two or more decimal places. (If necessary, consult a list of formulas.)
Step by Step Solution
There are 3 Steps involved in it

Get step-by-step solutions from verified subject matter experts