

Question: pleaseee hellppppp Sse ra esp o d us Ra Chase Fashions, Inc. Income Statement Years Ended December 31, 2018 and 2017 2018 $ 228,000 $
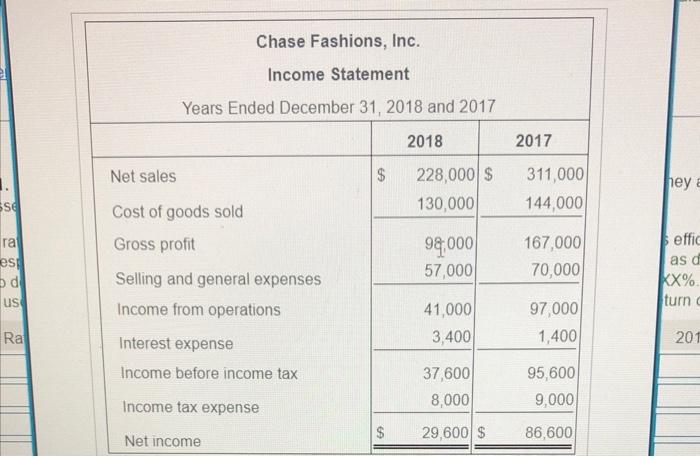
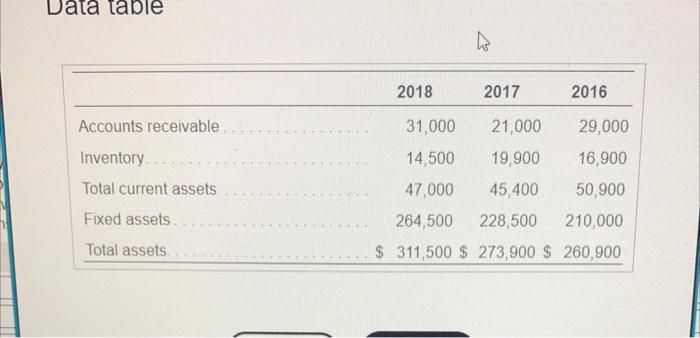
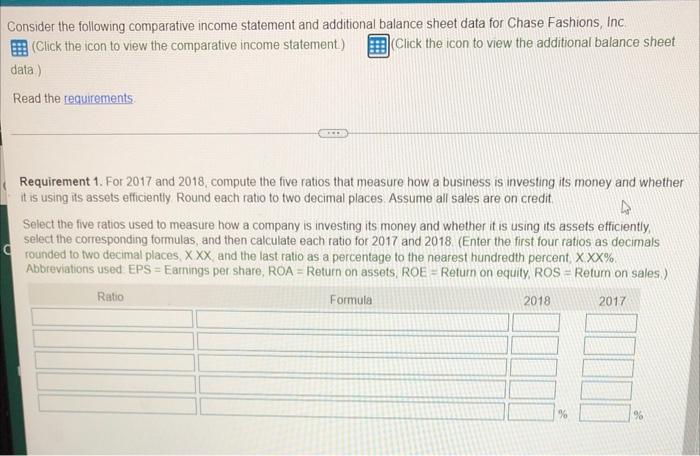
Sse ra esp o d us Ra Chase Fashions, Inc. Income Statement Years Ended December 31, 2018 and 2017 2018 $ 228,000 $ 130,000 98,000 57,000 41,000 3,400 37,600 8,000 29,600 $ Net sales Cost of goods sold Gross profit Selling and general expenses Income from operations Interest expense Income before income tax Income tax expense Net income $ 2017 311,000 144,000 167,000 70,000 97,000 1,400 95,600 9,000 86,600 hey a effic as d XX% turn c 201 ta table Accounts receivable. Inventory Total current assets Fixed assets. Total assets. 2018 2017 2016 31,000 21,000 29,000 14,500 19,900 16,900 47,000 45,400 50,900 264,500 228,500 210,000 $ 311,500 $ 273,900 $260,900 Consider the following comparative income statement and additional balance sheet data for Chase Fashions, Inc. (Click the icon to view the comparative income statement.) (Click the icon to view the additional balance sheet data) Read the requirements. *** Requirement 1. For 2017 and 2018, compute the five ratios that measure how a business is investing its money and whether it is using its assets efficiently. Round each ratio to two decimal places. Assume all sales are on credit. 4 Select the five ratios used to measure how a company is investing its money and whether it is using its assets efficiently, select the corresponding formulas, and then calculate each ratio for 2017 and 2018 (Enter the first four ratios as decimals rounded to two decimal places, XXX, and the last ratio as a percentage to the nearest hundredth percent, X.XX%. Abbreviations used EPS = Earnings per share, ROA = Return on assets, ROE = Return on equity, ROS = Return on sales.) Ratio Formula 2018 2017 %
Step by Step Solution
There are 3 Steps involved in it

Get step-by-step solutions from verified subject matter experts