

Question: Pleaseee help and dont forget the 3 comments 1. Input into an Excel spreadsheet the FY 2016 numbers for the company Sturm, Ruger & Co,
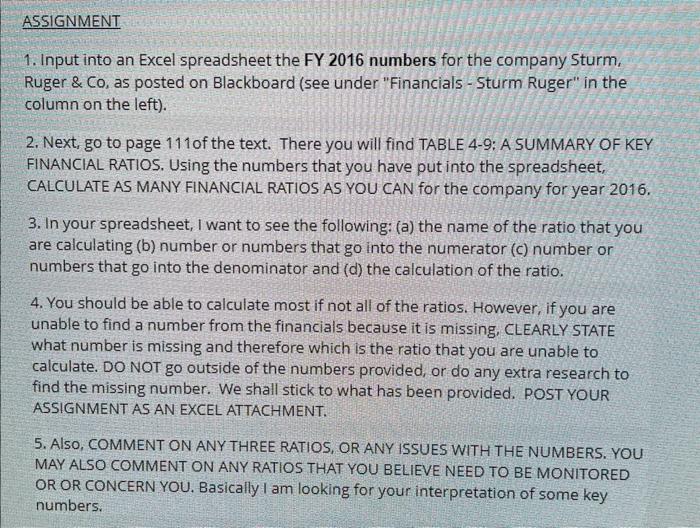
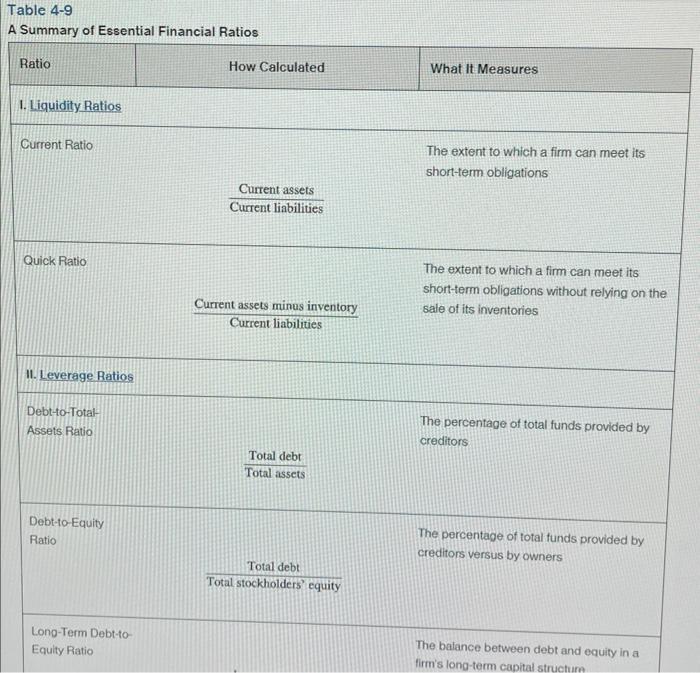
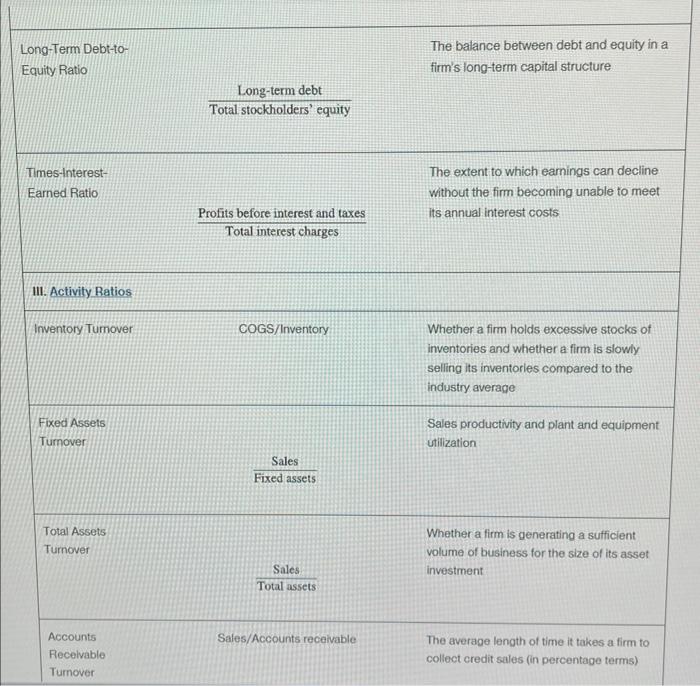
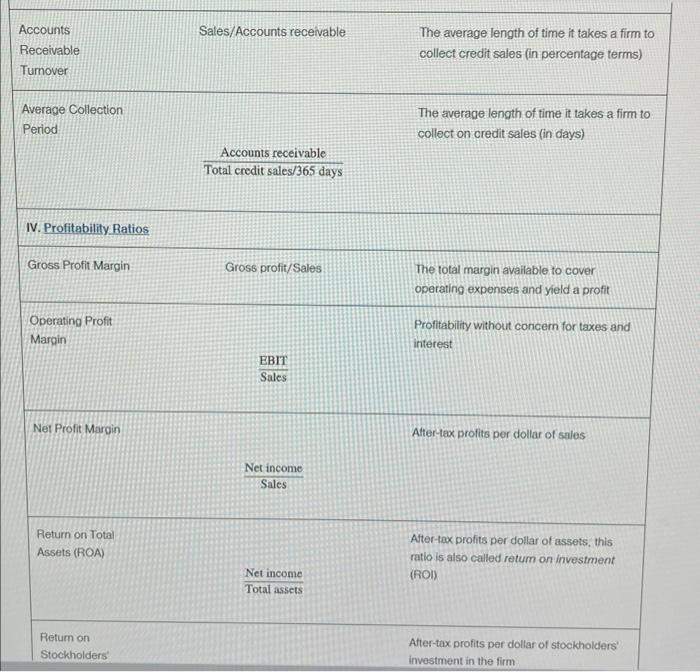
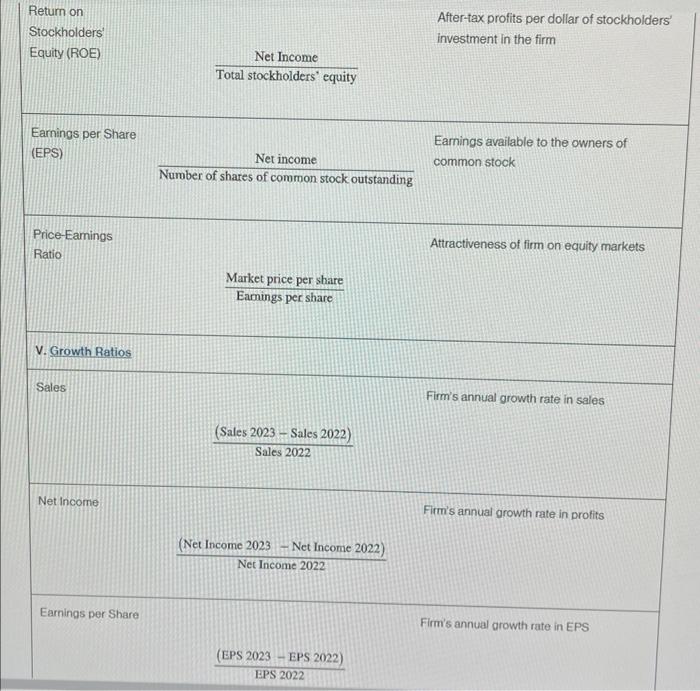
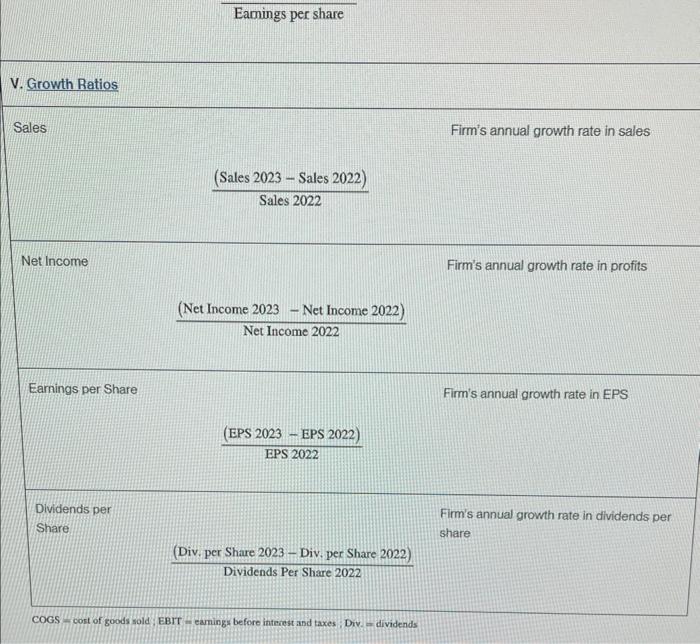
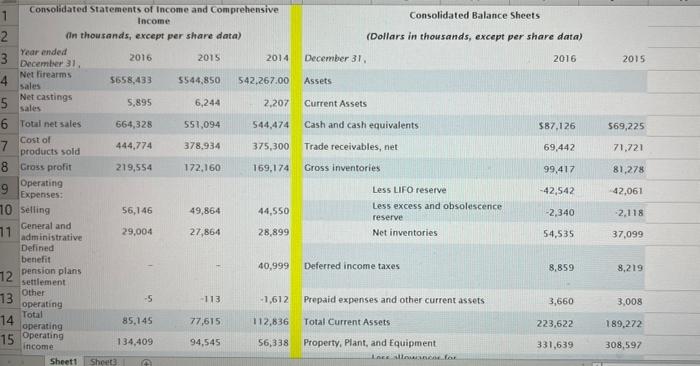
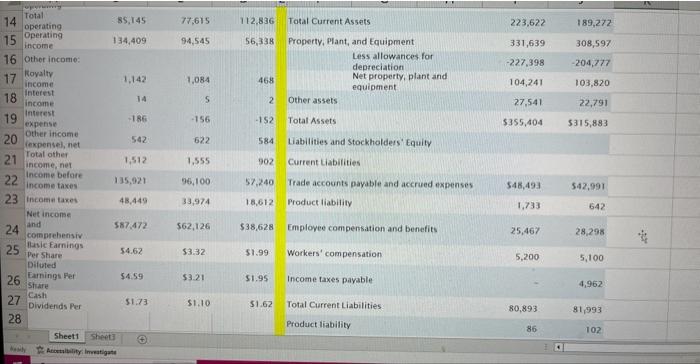
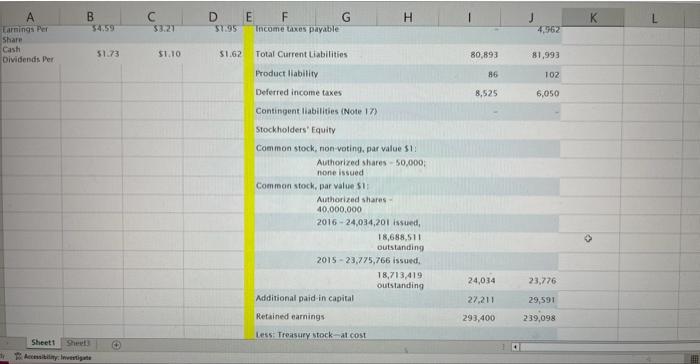
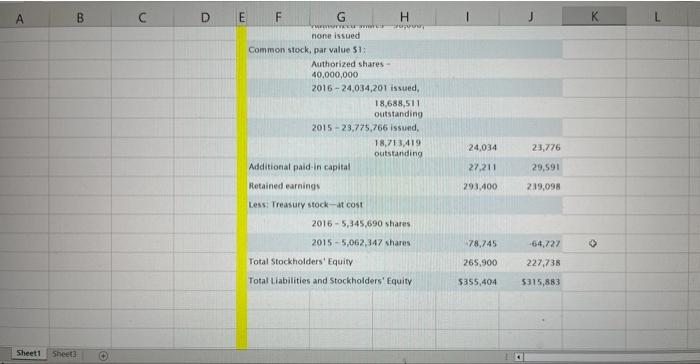
1. Input into an Excel spreadsheet the FY 2016 numbers for the company Sturm, Ruger \& Co, as posted on Blackboard (see under "Financials - Sturm Ruger" in the column on the left). 2. Next, go to page 111 of the text. There you will find TABLE 4-9: A SUMMARY OF KEY FINANCIAL RATIOS. Using the numbers that you have put into the spreadsheet, CALCULATE AS MANY FINANCIAL RATIOS AS YOU CAN for the company for year 2016. 3. In your spreadsheet, I want to see the following: (a) the name of the ratio that you are calculating (b) number or numbers that go into the numerator (c) number or numbers that go into the denominator and (d) the calculation of the ratio. 4. You should be able to calculate most if not all of the ratios. However, if you are unable to find a number from the financials because it is missing, CLEARLY STATE what number is missing and therefore which is the ratio that you are unable to calculate. DO NOT go outside of the numbers provided, or do any extra research to find the missing number. We shall stick to what has been provided. POST YOUR ASSIGNMENT AS AN EXCEL ATTACHMENT. 5. AlSO, COMMENT ON ANY THREE RATIOS, OR ANY ISSUES WITH THE NUMBERS. YOU MAY ALSO COMMENT ON ANY RATIOS THAT YOU BELIEVE NEED TO BE MONITORED OR OR CONCERN YOU. Basically I am looking for your interpretation of some key numbers. Table 4-9 A Summary of Essential Financial Ratios Ratio How Calculated What it Measures 1. Liquidity Ratios Current Ratio The extent to which a firm can meet its short-term obligations Current assets Current liabilities Quick Ratio The extent to which a firm can meet its Current assets minus inventory short-term obligations without relying on the Current liabilities sale of its inventories II. Leverage Ratios Debt-o-Total The percentage of total funds provided by Assets Ratio creditors TotalassetsTotaldebt Debt-to-Equity The percentage of total funds provided by Ratio creditors versus by owners Long-Term Debt-to- Total debt Total stockholders' equity Equity Ratio The balance between debt and equity in a firm's long-term capital structurn Long-Term Debt-to- Equity Ratio The balance between debt and equity in a firm's long-term capital structure TotalstockholdersequityLong-termdebt Times-interest- Earned Ratio The extent to which eamings can decline without the firm becoming unable to meet its annual interest costs Profits before interest and taxes Total interest charges 1II. Activity Ratios Inventory Tumover COGS/Inventory Whether a firm holds excessive stocks of inventories and whether a firm is slowly selling its inventorles compared to the industry average Fixed Assets Sales productivity and plant and equipment Turnover utilization Total Assets Whether a firm is generating a sufficient Turnover volume of business for the size of its asset Fixed assets investment Accounts Sales/Accounts receivable The average length of time it takes a firm to Recelvable collect credit sales (in percentage terms) Turnover Accounts Receivable Turnover Average Collection Period Sales/Accounts receivable The average length of time it takes a firm to collect credit sales (in percentage terms) Accounts receivable Total credit sales /365 days The average length of time it takes a firm to collect on credit sales (in days) IV. Profitability Ratios Gross Profit Margin Gross profit/Sales The total margin available to cover operating expenses and yield a profit Operating Profit Margin Profitability without concern for taxes and interest SalesEBIT Net Profit Margin After-tax profits per dollar of sales Net income Sales Return on Total Atter-tax profits per dollar of assets, this Assets (ROA) ratio is also called retum on investment Net income (ROi) Total assets Return on After-tax profits per dollar of stockholders' Stockholders investment in the firm Return on Stockholders' Equity (ROE) After-tax profits per dollar of stockholders investment in the firm Earnings per Share (EPS) Net Income Total stockholders' equity Price-Eamings Eamings available to the owners of Net income common stock Ratio Attractiveness of firm on equity markets Number of shares of common stock outstanding v. Growth Ratios Sales Firm's annual growth rate in sales Sales2022(Sales2023Sales2022) Net Income Firn's annual growth rate in profits (Net Income 2023 - Net Income 2022) Net Income 2022 Earnings per Share Firm's annual drowth rate in EPS (EPS 2023 - EPS 2022) EPS 2022 Eamings per share Growth Ratios Firm's annual growth rate in sales (Sales 2023 - Sales 2022) Sales 2022 Firm's annual growth rate in profits (Net Income 2023 - Net Income 2022) Net Income 2022 Earnings per Share Firm's annual growth rate in EPS EPS2022(EPS2023EPS2022) Dividends per Share Firm's annual growth rate in dividends pe share (Div, per Share 2023 - Div, per Share 2022) Dividends Per Share 2022 COGS - cost of goods sold : EBIT = eamings before interest and taxes; Div. = dividends \begin{tabular}{|c|c|c|c|c|c|c|} \hline \multicolumn{4}{|c|}{\begin{tabular}{l} Consolidated statements of Income and Comprehensive \\ Income \\ (In thousands, except per share data) \end{tabular}} & \multicolumn{3}{|c|}{\begin{tabular}{l} Consolidated Balance Sheets \\ rs in thousands, except per share data) \end{tabular}} \\ \hline \begin{tabular}{l} Year ended \\ Decemter 31 . \end{tabular} & 2016 & 2015 & 2014 & December 31 , & 2016 & 2015 \\ \hline \begin{tabular}{l} Net firearms \\ sales \end{tabular} & 5658,433 & 5544,850 & 542,267.00 & Assets & & \\ \hline \begin{tabular}{l} Net castings \\ sales \end{tabular} & 5.895 & 6,244 & 2.207 & Current Assets & & \\ \hline Totail net sales & 664,328 & 551,094 & 544,474 & Cash and cash equivalents & $87,126 & 569,225 \\ \hline \begin{tabular}{l} Cost of \\ products sold \end{tabular} & 444,774 & 378,934 & 375,300 & Trade receivables, net & 69,442 & 71,721 \\ \hline Cross profit & 219,554 & 172,160 & 169,174 & Gross inventories & 99,417 & 81,278 \\ \hline \begin{tabular}{l} Operating \\ Expenses: \end{tabular} & & & & Less LIFO reserve & 42,542 & 42,061 \\ \hline selling & 56,146 & 49,864 & 44,550 & \begin{tabular}{l} Less excess and obsolescence \\ reserve \end{tabular} & 2,340 & 2,118 \\ \hline \begin{tabular}{l} General and \\ administrative \end{tabular} & 29,004 & 27,864 & 28,899 & Net inventories & 54,535 & 37,099 \\ \hline \begin{tabular}{l} Defined \\ beriefit \\ pension plans \\ settlement \end{tabular} & = & - & 40,999 & Deferred income taxes & 8,859 & 8,219 \\ \hline \begin{tabular}{l} Other \\ operating \end{tabular} & -5 & -113 & 1,612 & Prepaid expenses and other current assets & 3,660 & 3,008 \\ \hline \begin{tabular}{l} Total \\ operating \end{tabular} & 85,145 & 77,615 & 112,836 & Total Current Assets & 223,622 & 189,272 \\ \hline \begin{tabular}{l} Operating \\ income \end{tabular} & 134,409 & 94,545 & 56,338 & Property, Plant, and Equipment. & 331,639 & 308,597 \\ \hline \end{tabular}
Step by Step Solution
There are 3 Steps involved in it

Get step-by-step solutions from verified subject matter experts