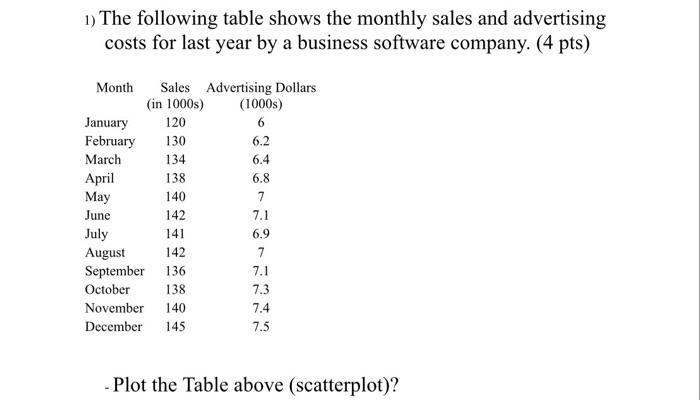
Question: plesase just plot scatterplot plesase just plot scatterplot plesase just plot scatterplot 1) The following table shows the monthly sales and advertising costs for last

plesase just plot scatterplot
plesase just plot scatterplot plesase just plot
1) The following table shows the monthly sales and advertising costs for last year by a business software company. (4 pts) 130 Month Sales Advertising Dollars (in 1000s) (1000) January 120 6 February 6.2 March 134 6.4 April 138 6.8 May 140 7 June 142 7.1 July 141 6.9 August 142 7 September 136 7.1 October 138 7.3 November 140 7.4 December 145 7.5 Plot the Table above (scatterplot)

Step by Step Solution

There are 3 Steps involved in it

1 Expert Approved Answer
Step: 1 Unlock blur-text-image
Question Has Been Solved by an Expert!

Get step-by-step solutions from verified subject matter experts

Step: 2 Unlock
Step: 3 Unlock

Students Have Also Explored These Related General Management Questions!