

Question: Plese write down the code This exercise will enable you to see the effect of different scales of surface profile on measured values of Ra.
Plese write down the code
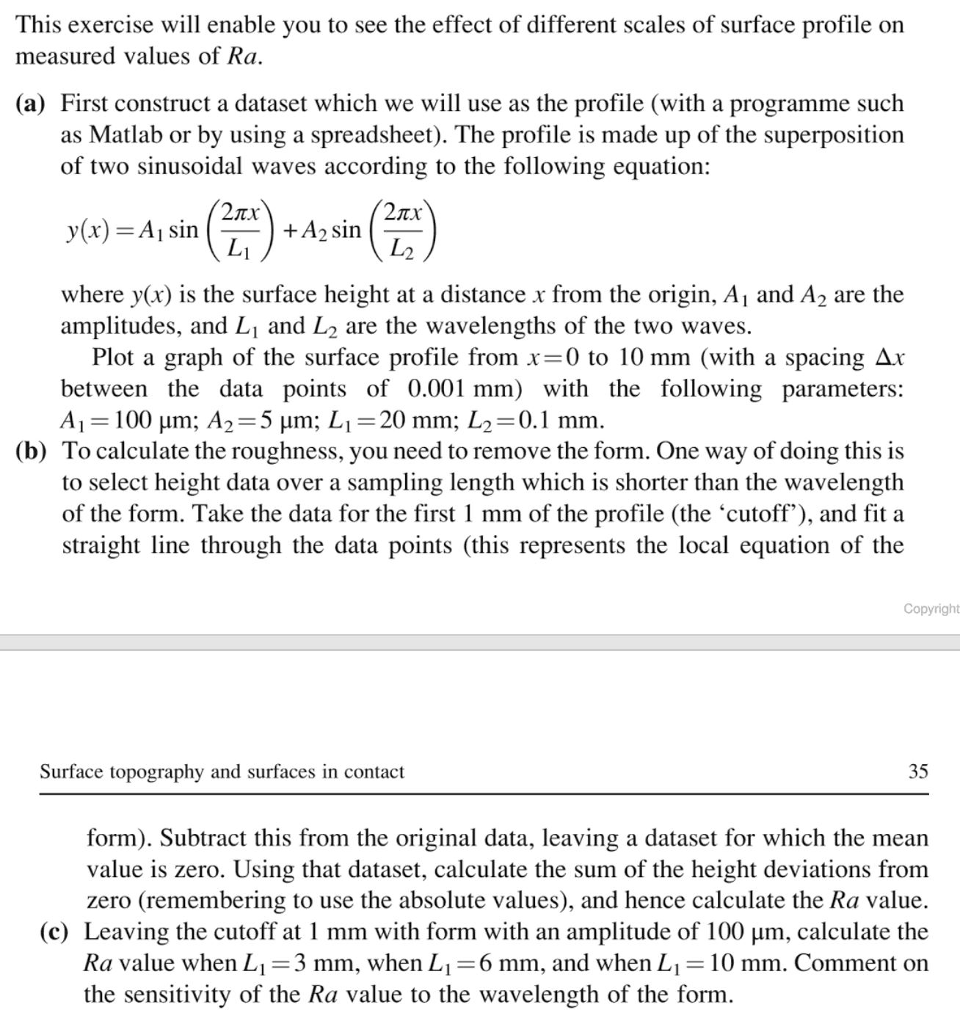
This exercise will enable you to see the effect of different scales of surface profile on measured values of Ra. (a) First construct a dataset which we will use as the profile (with a programme such as Matlab or by using a spreadsheet). The profile is made up of the superposition of two sinusoidal waves according to the following equation: 2itx y(x) =A1 sin 2 where y(x) is the surface height at a distance x from the origin, A1 and A2 are the amplitudes, and L1 and L2 are the wavelengths of the two waves Plot a graph of the surface profile from x-0 to 10 mm (with a spacing Ar between the data points of 0.001 mm) with the following parameters: m: A,-5 m; L, - 20 mm; L2 -0.1 mm (b) To calculate the roughness, you need to remove the form. One way of doing this is to select height data over a sampling length which is shorter than the wavelength of the form. Take the data for the first 1 mm of the profile (the cutoff'), and fit a straight line through the data points (this represents the local equation of the Copyright Surface topography and surfaces in contact 35 form). Subtract this from the original data, leaving a dataset for which the mean value is zero. Using that dataset, calculate the sum of the height deviations from zero (remembering to use the absolute values), and hence calculate the Ra value. (c) Leaving the cutoff at 1 mm with form with an amplitude of 100 m, calculate the Ra value when Li-3 mm, when L1 6 mm, and when L 10 mm. Comment on the sensitivity of the Ra value to the wavelength of the form This exercise will enable you to see the effect of different scales of surface profile on measured values of Ra. (a) First construct a dataset which we will use as the profile (with a programme such as Matlab or by using a spreadsheet). The profile is made up of the superposition of two sinusoidal waves according to the following equation: 2itx y(x) =A1 sin 2 where y(x) is the surface height at a distance x from the origin, A1 and A2 are the amplitudes, and L1 and L2 are the wavelengths of the two waves Plot a graph of the surface profile from x-0 to 10 mm (with a spacing Ar between the data points of 0.001 mm) with the following parameters: m: A,-5 m; L, - 20 mm; L2 -0.1 mm (b) To calculate the roughness, you need to remove the form. One way of doing this is to select height data over a sampling length which is shorter than the wavelength of the form. Take the data for the first 1 mm of the profile (the cutoff'), and fit a straight line through the data points (this represents the local equation of the Copyright Surface topography and surfaces in contact 35 form). Subtract this from the original data, leaving a dataset for which the mean value is zero. Using that dataset, calculate the sum of the height deviations from zero (remembering to use the absolute values), and hence calculate the Ra value. (c) Leaving the cutoff at 1 mm with form with an amplitude of 100 m, calculate the Ra value when Li-3 mm, when L1 6 mm, and when L 10 mm. Comment on the sensitivity of the Ra value to the wavelength of the form
Step by Step Solution
There are 3 Steps involved in it

Get step-by-step solutions from verified subject matter experts