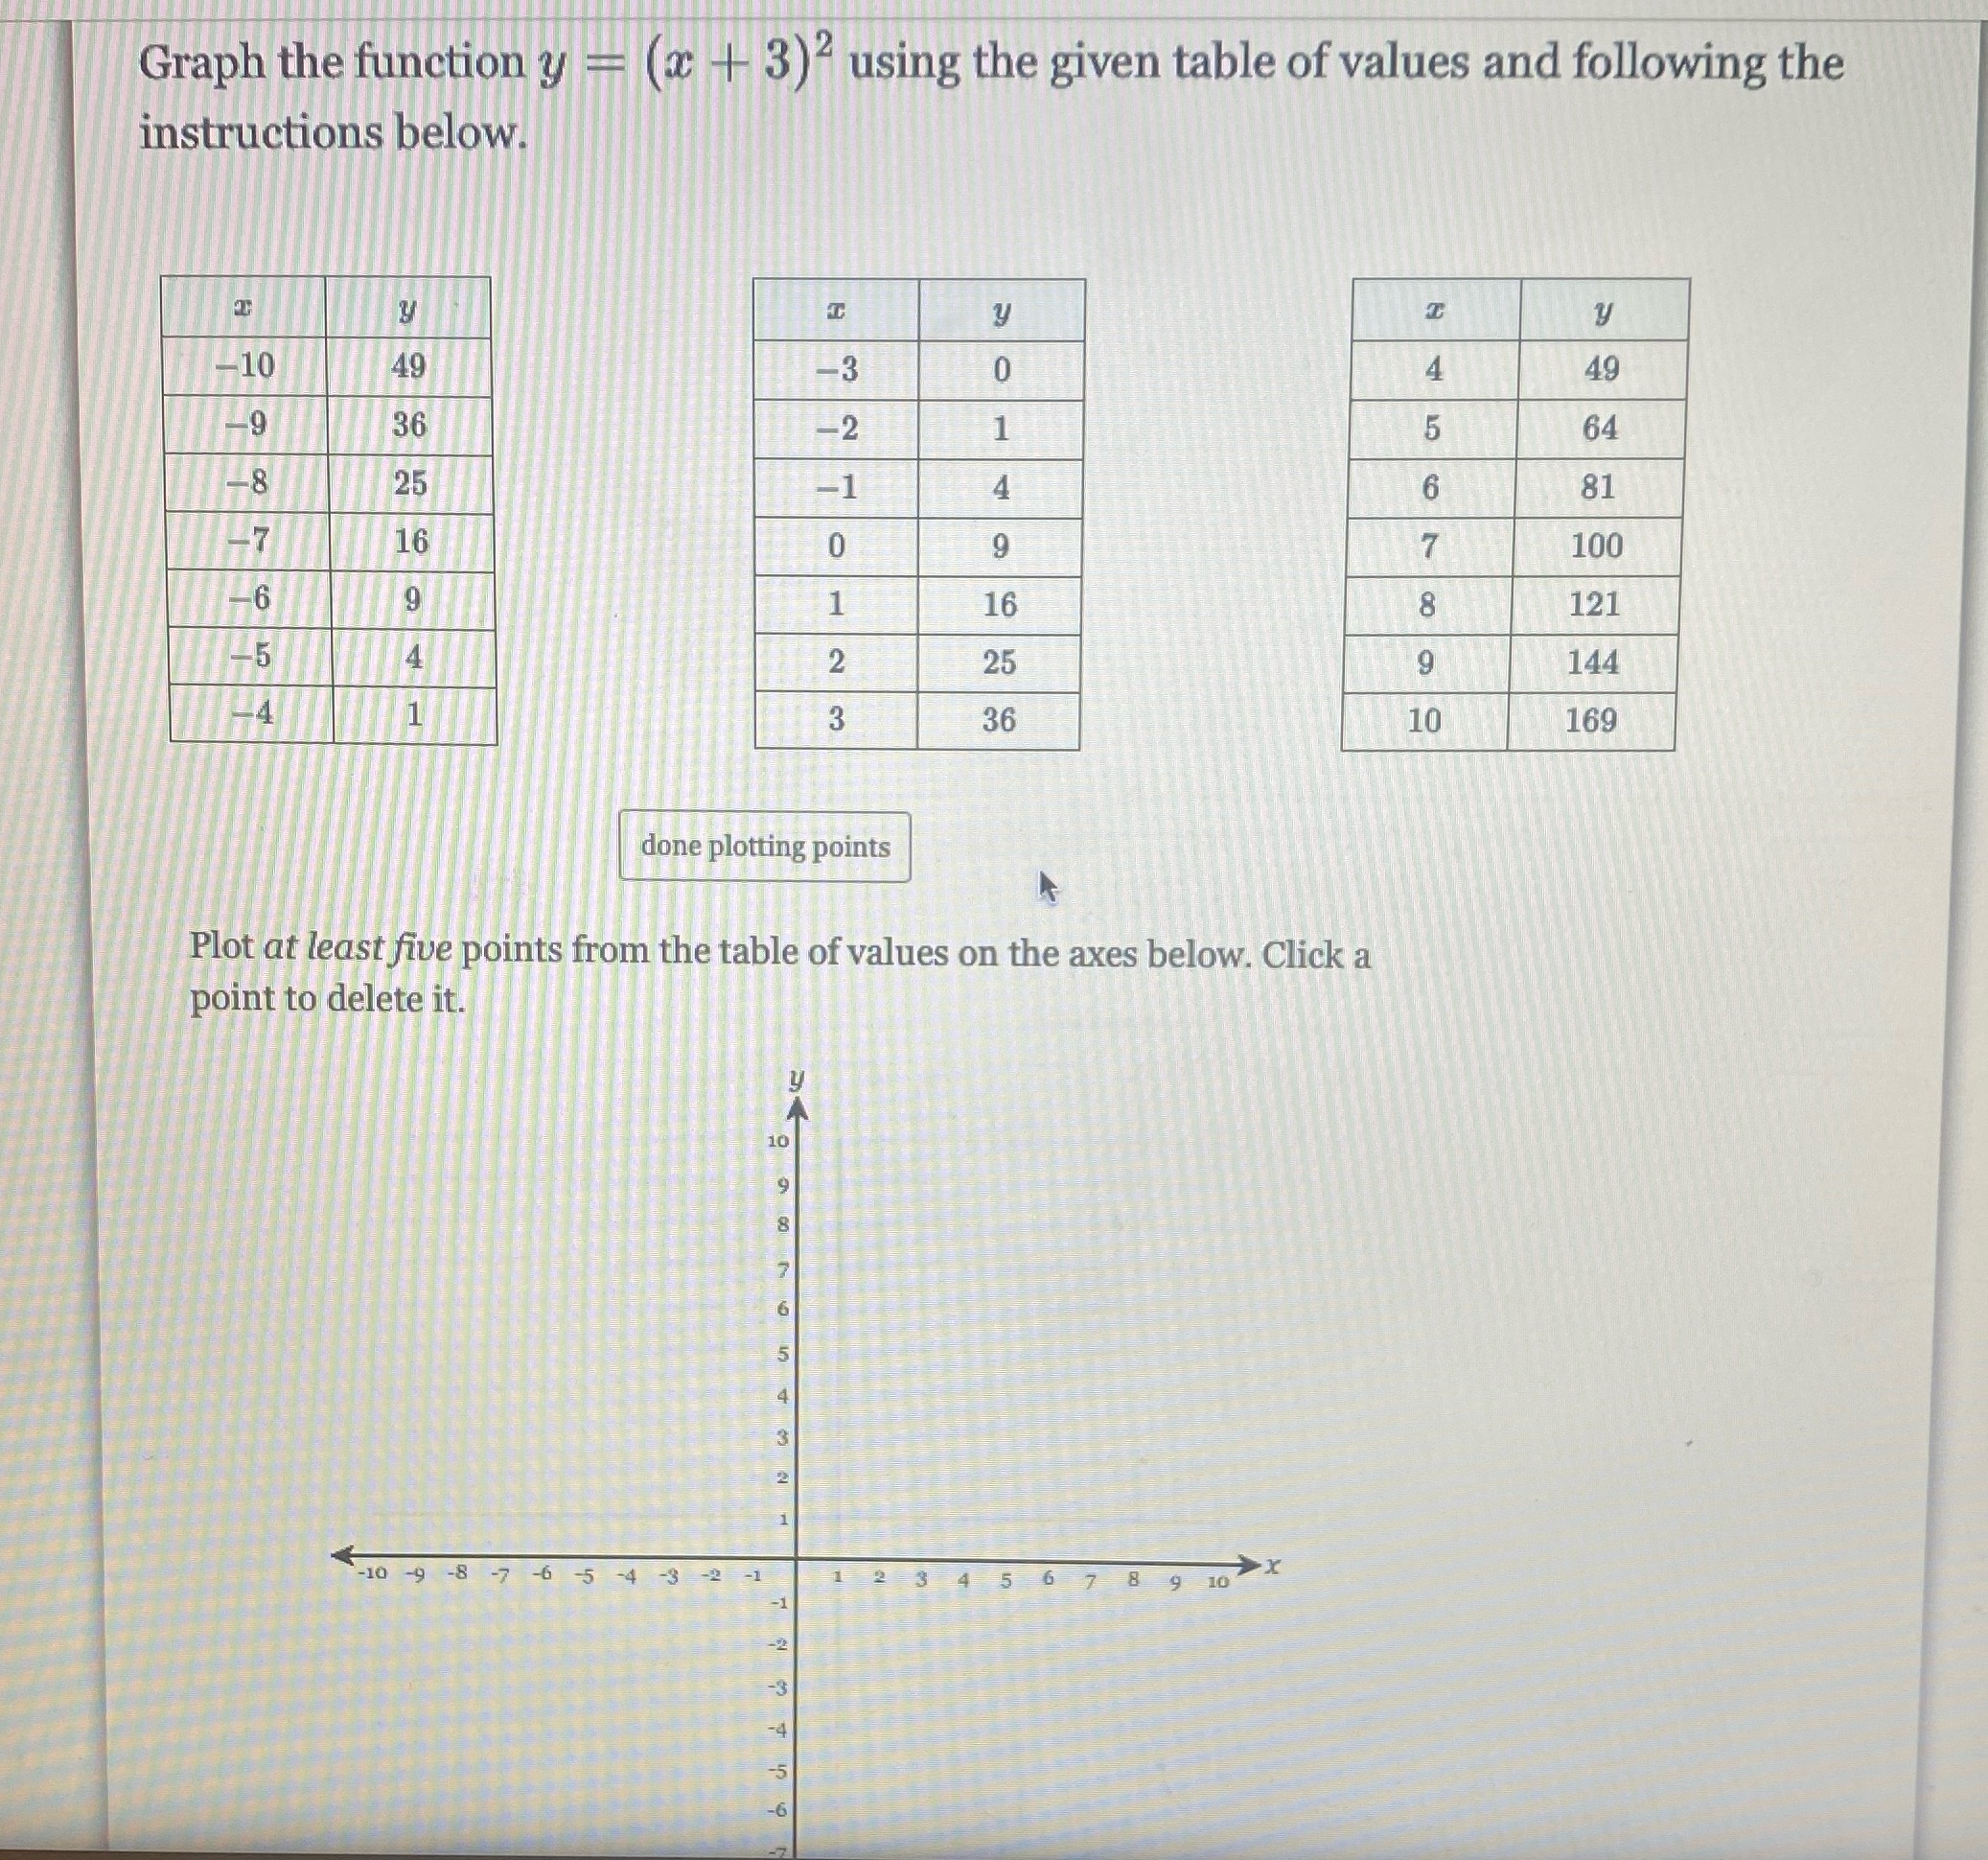
Question: plot 5 points from the table of values on the axes below. (what are the points ) Graph the function y - (x + 3)2

plot 5 points from the table of values on the axes below. (what are the points )

plot 5 points from the table of values on the
Graph the function y - (x + 3)2 using the given table of values and following the instructions below. C y y -10 49 -3 0 4 49 -9 36 -2 1 5 64 -8 25 -1 4 6 81 16 0 9 7 100 -6 19 1 16 8 121 -5 4 2 25 9 144 1 3 36 10 169 done plotting points Plot at least five points from the table of values on the axes below. Click a point to delete it. -10 -9 - 8 -7 -6 5 -4 -3-2 4 5 6 7 8 9 10

Step by Step Solution

There are 3 Steps involved in it

1 Expert Approved Answer
Step: 1 Unlock blur-text-image
Question Has Been Solved by an Expert!

Get step-by-step solutions from verified subject matter experts

Step: 2 Unlock
Step: 3 Unlock

Students Have Also Explored These Related Mathematics Questions!