

Question: Plot a graph of distance vs time TABLE 1 Distance (cm) 20 20 20 20 20 Time (s) 02 04 06 68 Plot a graph
Plot a graph of distance vs time
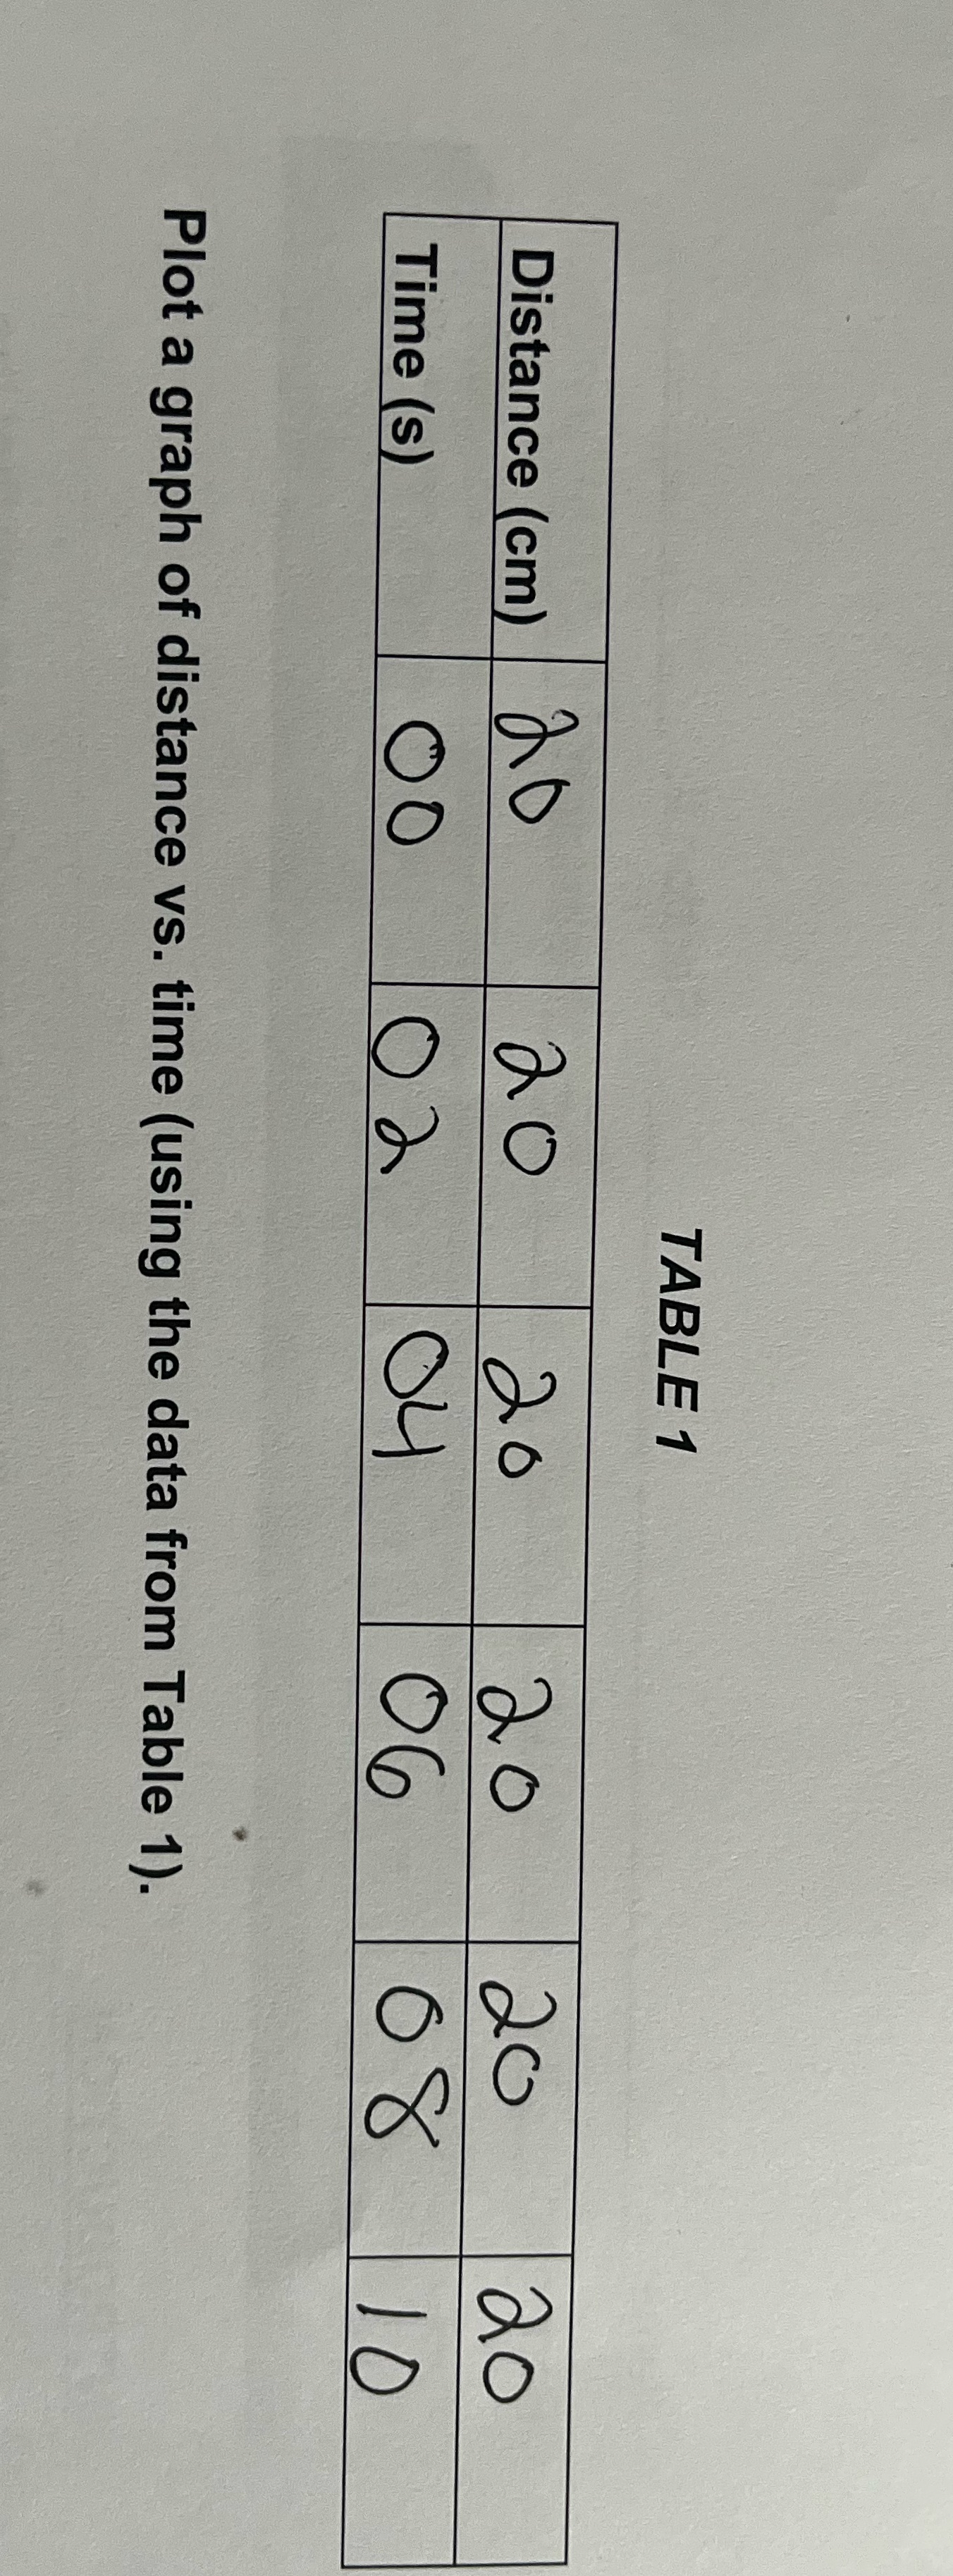
TABLE 1 Distance (cm) 20 20 20 20 20 Time (s) 02 04 06 68 Plot a graph of distance vs. time (using the data from Table 1)
Step by Step Solution
There are 3 Steps involved in it
1 Expert Approved Answer
Step: 1 Unlock

Question Has Been Solved by an Expert!
Get step-by-step solutions from verified subject matter experts
Step: 2 Unlock
Step: 3 Unlock