

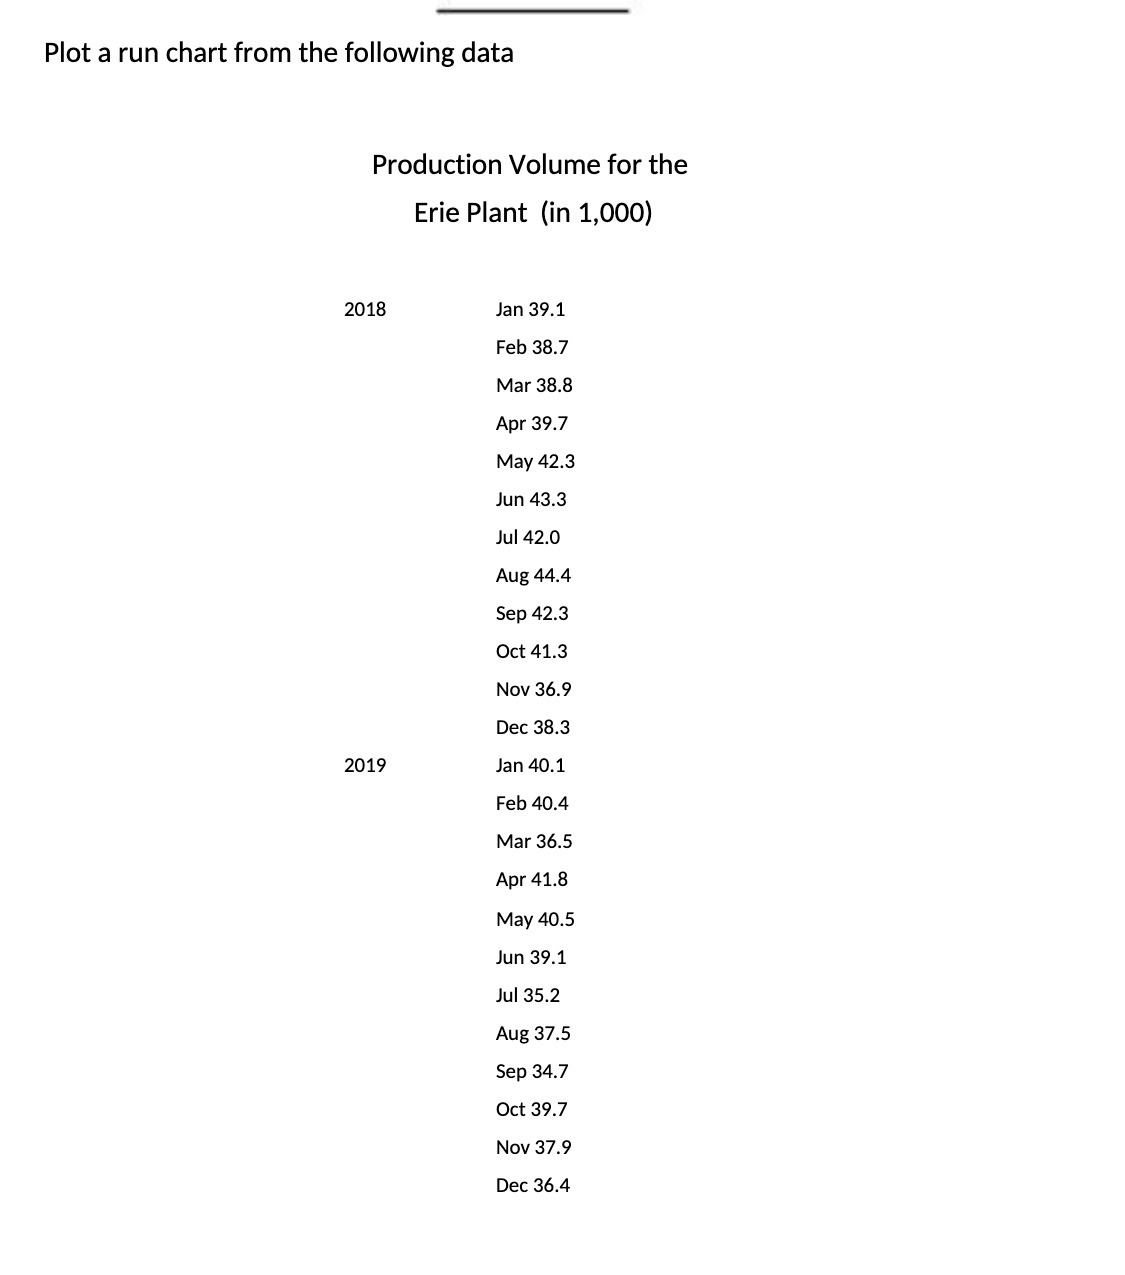
Question: Plot a run chart from the following data Production Volume for the Erie Plant (in 1,000) 2018 Jan 39.1 Feb 38.7 Mar 38.8 Apr 39.7
Step by Step Solution
There are 3 Steps involved in it
1 Expert Approved Answer
Step: 1 Unlock

Question Has Been Solved by an Expert!
Get step-by-step solutions from verified subject matter experts
Step: 2 Unlock
Step: 3 Unlock