

Question: Plot a similar graph as shown below for drawing wire of material properties K = 0.05. Add MATLAB file and .png of the plot
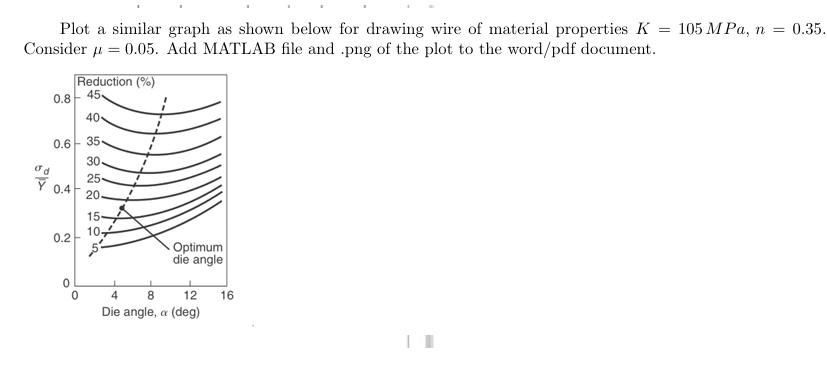
Plot a similar graph as shown below for drawing wire of material properties K = 0.05. Add MATLAB file and .png of the plot to the word/pdf document. Consider od Y Reduction (%) 45 40- 0.6 35- 30. 25- 0.8 0.4 0.2 0 T ~ N 50 0 = 20 15- 10 5- Optimum die angle 1 4 8 Die angle, a (deg) 12 16 - 105 M Pa, n = 0.35.
Step by Step Solution
There are 3 Steps involved in it
1 Expert Approved Answer
Step: 1 Unlock

Heres an example of how you can create a stressstrain curve in MATLAB based on the gi... View full answer
Question Has Been Solved by an Expert!
Get step-by-step solutions from verified subject matter experts
Step: 2 Unlock
Step: 3 Unlock