

Question: Plot a sinusoid as follows: a. Use linspace to create a vector called myangle containing 101 points from 0 to 4. b. Create another vector
Plot a sinusoid as follows: a. Use linspace to create a vector called myangle containing 101 points from 0 to 4. b. Create another vector called response containing the sine of myangle. (myangle is in radians.) c. Plot response vs. myangle with a solid red line with no symbols. d. Label the x axis Angle (radians) e. Label the y axis Response (psi) f. Title the plot Pressure Response g. Add a grid. h. Create another vector called cresponse containing the cosine of myangle. i. Add another line to the plot containing cresponse. Use a black dotted line with circles for symbols. (Dont forget hold on before plotting the line, otherwise the first line will be erased.) j. Write the result to a file in png format.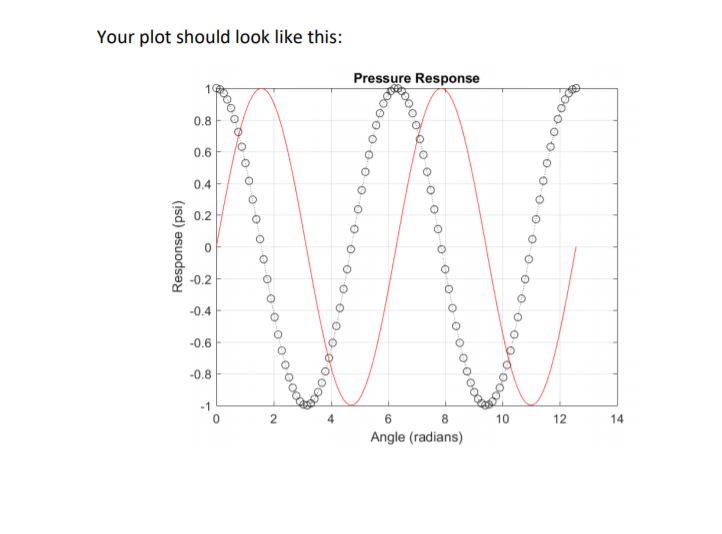
oooooo 0-0-0-0 0-0-0 o 9 90 4 2 00.00 o-ooooooo 0 864202 4681 (sd) asuoday
Step by Step Solution
There are 3 Steps involved in it

Get step-by-step solutions from verified subject matter experts