

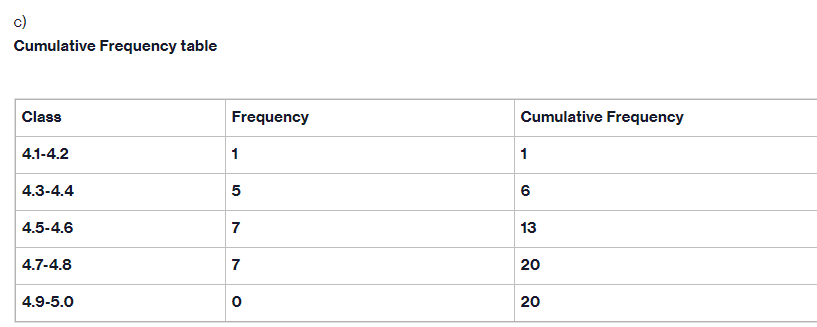
Question: Plot a suitable cumulative frequency graph. ( in the x-axis put upper class boundary) (e) Use your cumulative frequency graph to determine if the data
Plot a suitable cumulative frequency graph.
( in the x-axis put upper class boundary)
(e) Use your cumulative frequency graph to determine if the data is normally distributed or not? and give me the reason
Step by Step Solution
There are 3 Steps involved in it
1 Expert Approved Answer
Step: 1 Unlock

Question Has Been Solved by an Expert!
Get step-by-step solutions from verified subject matter experts
Step: 2 Unlock
Step: 3 Unlock