

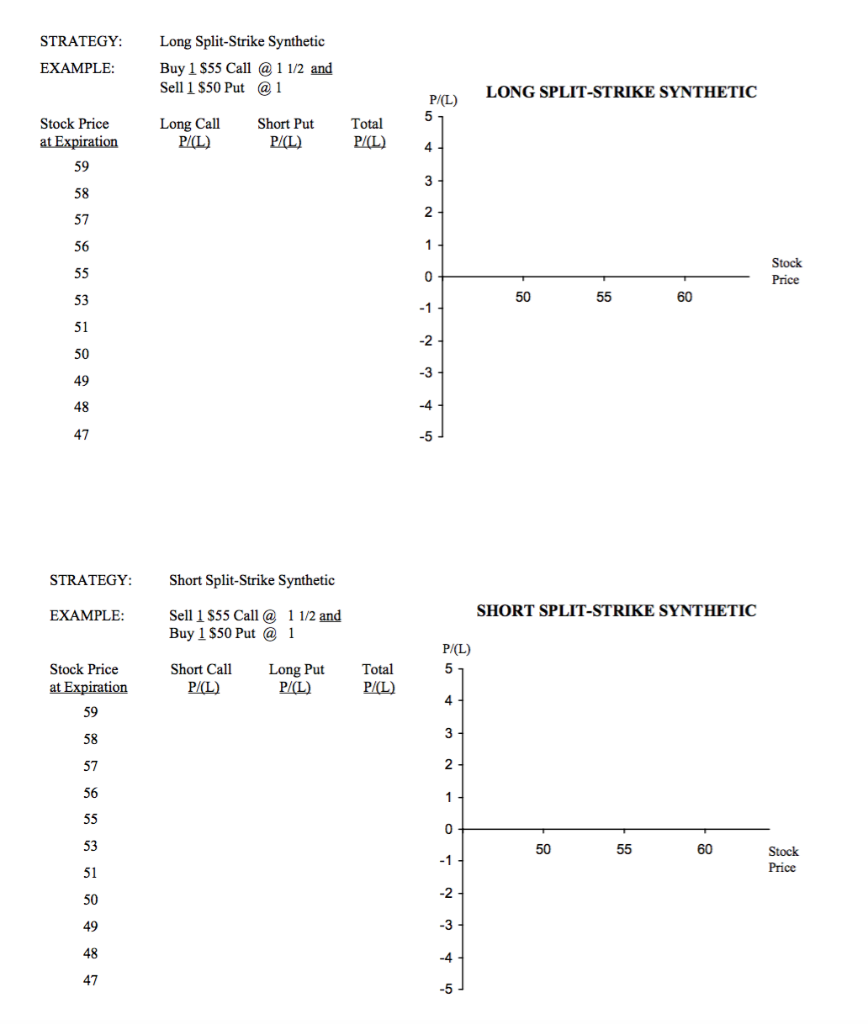
Question: plot and graph STRATEGY: EXAMPLE: Long Split-Strike Synthetic Buy 1 $55 Call @ 1 1/2 and Sell 1 $50 Put @1 LONG SPLIT-STRIKE SYNTHETIC Stock
 plot and graph
STRATEGY: EXAMPLE: Long Split-Strike Synthetic Buy 1 $55 Call @ 1 1/2 and Sell 1 $50 Put @1 LONG SPLIT-STRIKE SYNTHETIC Stock Price at Expiration Long Call P/(L) Short Put P/(L) Total P/(L) - Stock Price 50 55 60 STRATEGY: Short Split-Strike Synthetic EXAMPLE: SHORT SPLIT-STRIKE SYNTHETIC Sell 1 $55 Call @ Buy 1 $50 Put @ 1 1/2 and 1 P/(L) Stock Price at Expiration Short Call P/(L) Total P/(L) P/(L) 50 55 60 Stock Price STRATEGY: EXAMPLE: Long Split-Strike Synthetic Buy 1 $55 Call @ 1 1/2 and Sell 1 $50 Put @1 LONG SPLIT-STRIKE SYNTHETIC Stock Price at Expiration Long Call P/(L) Short Put P/(L) Total P/(L) - Stock Price 50 55 60 STRATEGY: Short Split-Strike Synthetic EXAMPLE: SHORT SPLIT-STRIKE SYNTHETIC Sell 1 $55 Call @ Buy 1 $50 Put @ 1 1/2 and 1 P/(L) Stock Price at Expiration Short Call P/(L) Total P/(L) P/(L) 50 55 60 Stock Price
Step by Step Solution
There are 3 Steps involved in it

Get step-by-step solutions from verified subject matter experts