

Question: Each of the following two data sets represents a straight line. 1. Draw a graph (plot the data points and draw the best-fit-straight-line) for
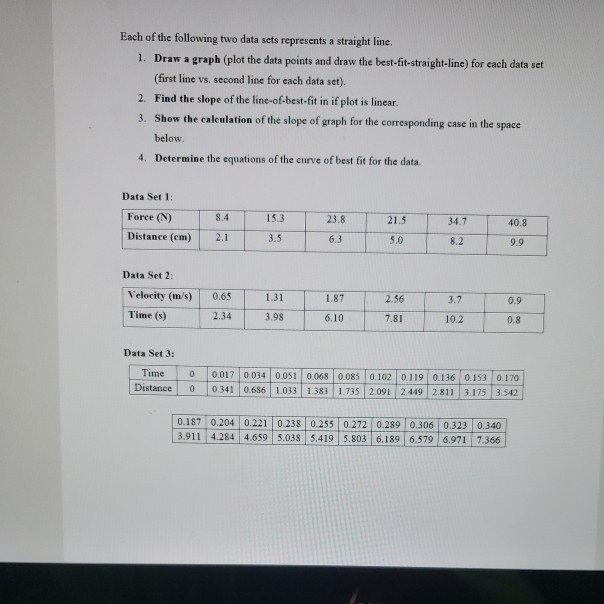
Each of the following two data sets represents a straight line. 1. Draw a graph (plot the data points and draw the best-fit-straight-line) for each data set (first line vs. second line for each data set). 2. Find the slope of the line-of-best-fit in if plot is linear. 3. Show the caleulation of the slope of graph for the corresponding case in the space below. 4. Determine the equations of the curve of best fit for the data. Data Set 1: Force (N) 8.4 15.3 23.8 21.5 34.7 40.8 Distance (em) 2.1 3.5 6.3 5.0 8.2 9.9 Data Set 2: Velocity (m/s) 0.65 1.31 1.87 2.56 3.7 0.9 Time (s) 2.34 3.98 6.10 7.81 10.2 0.8 Data Set 3: Time 0.017 0.0340.051 0.068 0.085 0.102 0.119 0.136 0.153 0.170o 0.341 0.686 1.033 1.383 1.735 2.091 2.449 2.811 3.175 3.542 Distance 0.187 0.204 0.221 0.238 0.255 0.272 0.289 0.306 0.323 0.340 3.911 4.284 4.659 5.038 5.419 5.803 6.189 6.579 6.971 7.366
Step by Step Solution
3.27 Rating (147 Votes )
There are 3 Steps involved in it
50 1 1 2 3 4 ... View full answer

Get step-by-step solutions from verified subject matter experts