

Question: Plot correlation coefficient as a function of time shift Exercise: (1) Create an array timeshift (using np.linspace) that goes from 0.02 to 0.02nx in nx
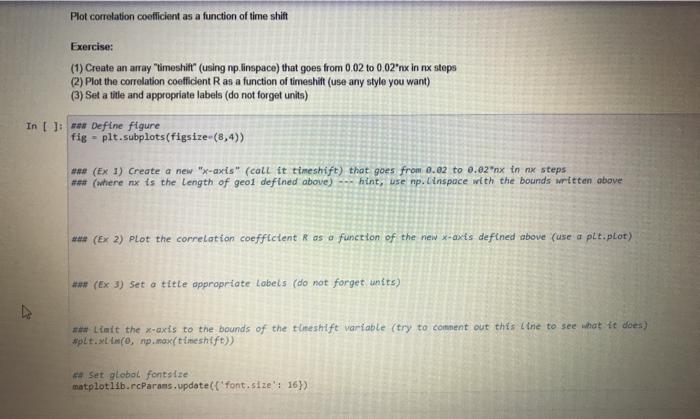
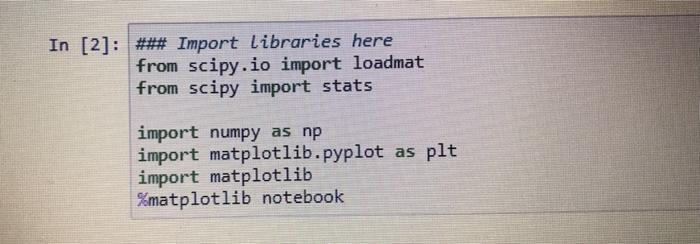
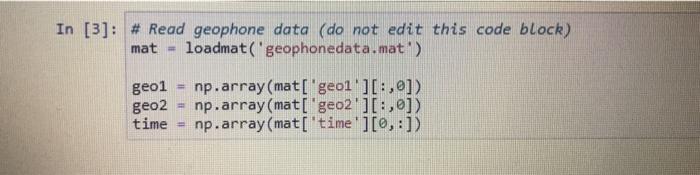
Plot correlation coefficient as a function of time shift Exercise: (1) Create an array "timeshift (using np.linspace) that goes from 0.02 to 0.02"nx in nx steps (2) Plot the correlation coefficient R as a function of timeshift (use any style you want) (3) Set a title and appropriate labels (do not forget units) In [ ]: waw Define figure fig - plt.subplots(figsize-(8,4)) *** (Ex 1) Create a new "x-axis" (call it timeshift) that goes from 0.02 to 0.02"nx in nx steps *** (where nx is the length of geol defined above) hint, use np. inspace with the bounds written above *** (Ex 2) Plot the correlation coefficient Ras a function of the new x-axis defined above (use a plt.plot) *** (Ex 3) Set a title appropriate Labels (do not forget units) *** Limit the x-axis to the bounds of the timeshift variable (try to comment out this line to see what it does) #plt.XLANCO, np.max(timeshift)) ** Set global fontsize matplotlib.rcparams.update('font.size': 16) In [2] : ### Import Libraries here from scipy.io import loadmat from scipy import stats import numpy as np import matplotlib.pyplot as plt import matplotlib %matplotlib notebook In [3]: # Read geophone data (do not edit this code block) mat loadmat('geophonedata.mat) geo1 geo2 time np.array(mat['geol'][:,0]) np.array(mat['geo2'][:,]) np.array(mat['time'][0,:]) Plot correlation coefficient as a function of time shift Exercise: (1) Create an array "timeshift (using np.linspace) that goes from 0.02 to 0.02"nx in nx steps (2) Plot the correlation coefficient R as a function of timeshift (use any style you want) (3) Set a title and appropriate labels (do not forget units) In [ ]: waw Define figure fig - plt.subplots(figsize-(8,4)) *** (Ex 1) Create a new "x-axis" (call it timeshift) that goes from 0.02 to 0.02"nx in nx steps *** (where nx is the length of geol defined above) hint, use np. inspace with the bounds written above *** (Ex 2) Plot the correlation coefficient Ras a function of the new x-axis defined above (use a plt.plot) *** (Ex 3) Set a title appropriate Labels (do not forget units) *** Limit the x-axis to the bounds of the timeshift variable (try to comment out this line to see what it does) #plt.XLANCO, np.max(timeshift)) ** Set global fontsize matplotlib.rcparams.update('font.size': 16) In [2] : ### Import Libraries here from scipy.io import loadmat from scipy import stats import numpy as np import matplotlib.pyplot as plt import matplotlib %matplotlib notebook In [3]: # Read geophone data (do not edit this code block) mat loadmat('geophonedata.mat) geo1 geo2 time np.array(mat['geol'][:,0]) np.array(mat['geo2'][:,]) np.array(mat['time'][0,:])
Step by Step Solution
There are 3 Steps involved in it

Get step-by-step solutions from verified subject matter experts