

Question: plot, draw, and label supply and demand curves and estimate Pe and Qe. if the government sets a price floor for this product at $8,
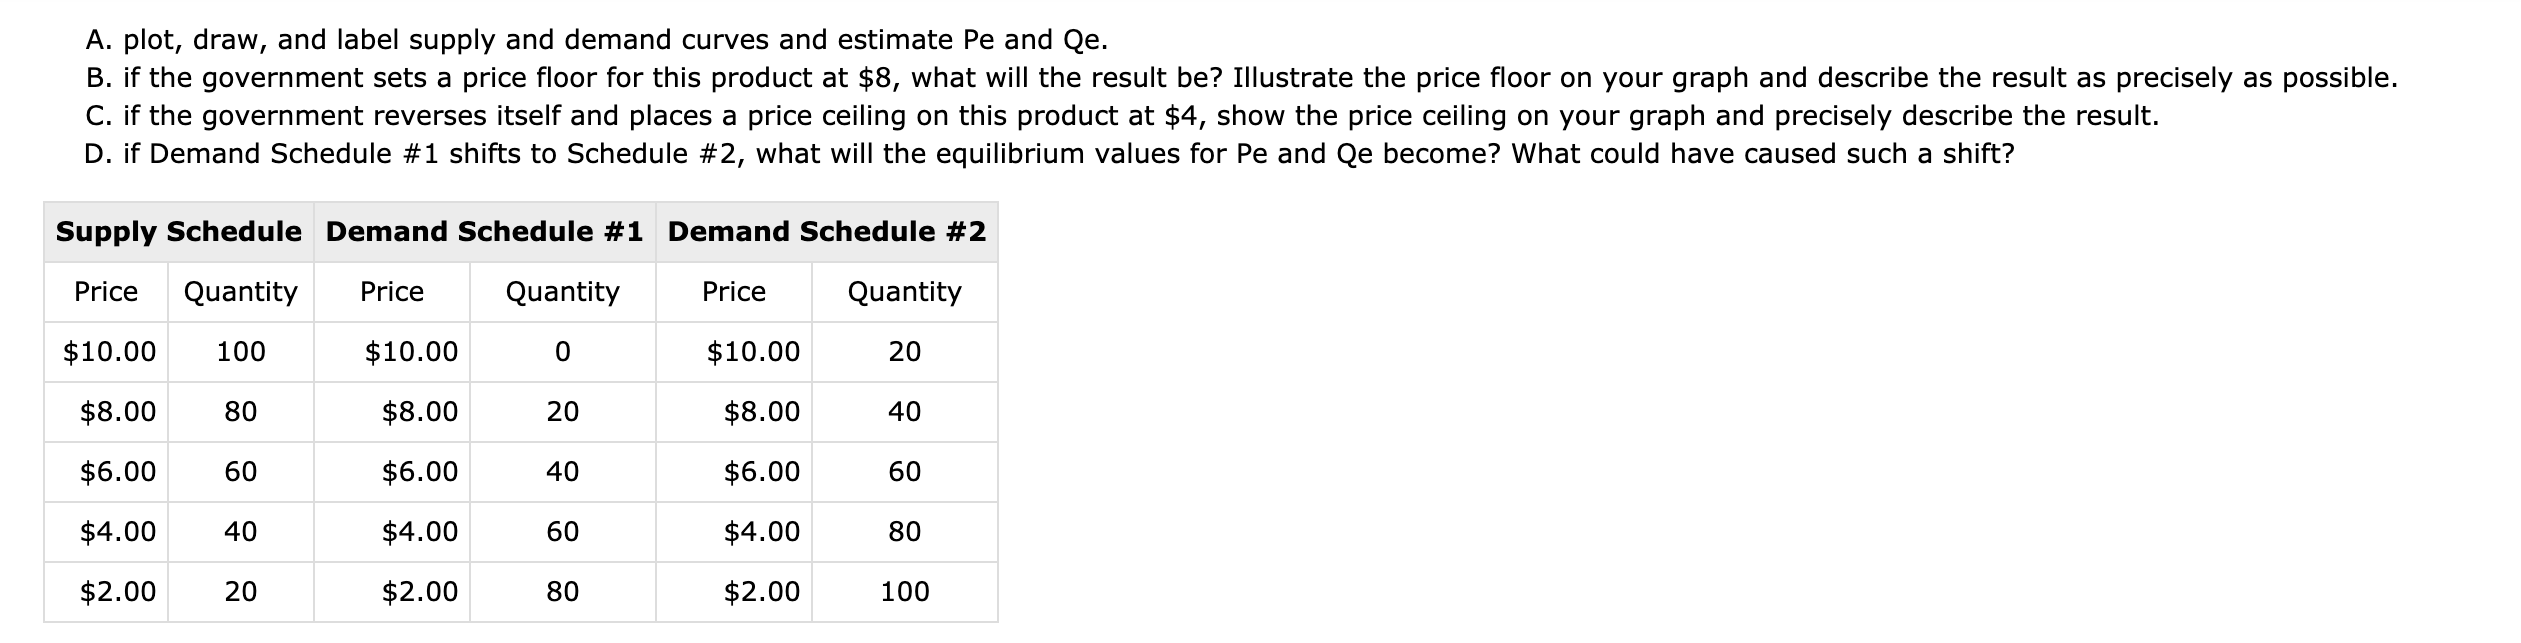
plot, draw, and label supply and demand curves and estimate Pe and Qe. if the government sets a price floor for this product at $8, what will the result be? Illustrate the price oor on your graph and describe the result as precisely as possible. if the government reverses itself and places a price ceiling on this product at $4, show the price ceiling on your graph and precisely describe the result. if Demand Schedule #1 shifts to Schedule #2, what will the equilibrium values for Pe and Qe become? What could have caused such a shift? POP\"? Supply Schedule Demand Schedule #1 Demand Schedule #2 Price Quantity Price Quantity Price Quantity $10.00 100 $10.00 0 $10.00 20 $8.00 80 $8.00 20 $8.00 40 $6.00 60 $6.00 40 $6.00 60 $4.00 40 $4.00 60 $4.00 80 $2.00 20 $2.00 80 $2.00 100
Step by Step Solution
There are 3 Steps involved in it

Get step-by-step solutions from verified subject matter experts