

Question: Plot Fermi - Dirac distribution function at 1 K , 5 0 K , 1 0 0 K , 2 0 0 K , 3
Plot FermiDirac distribution function at KKKKK and K using EXCEL software.
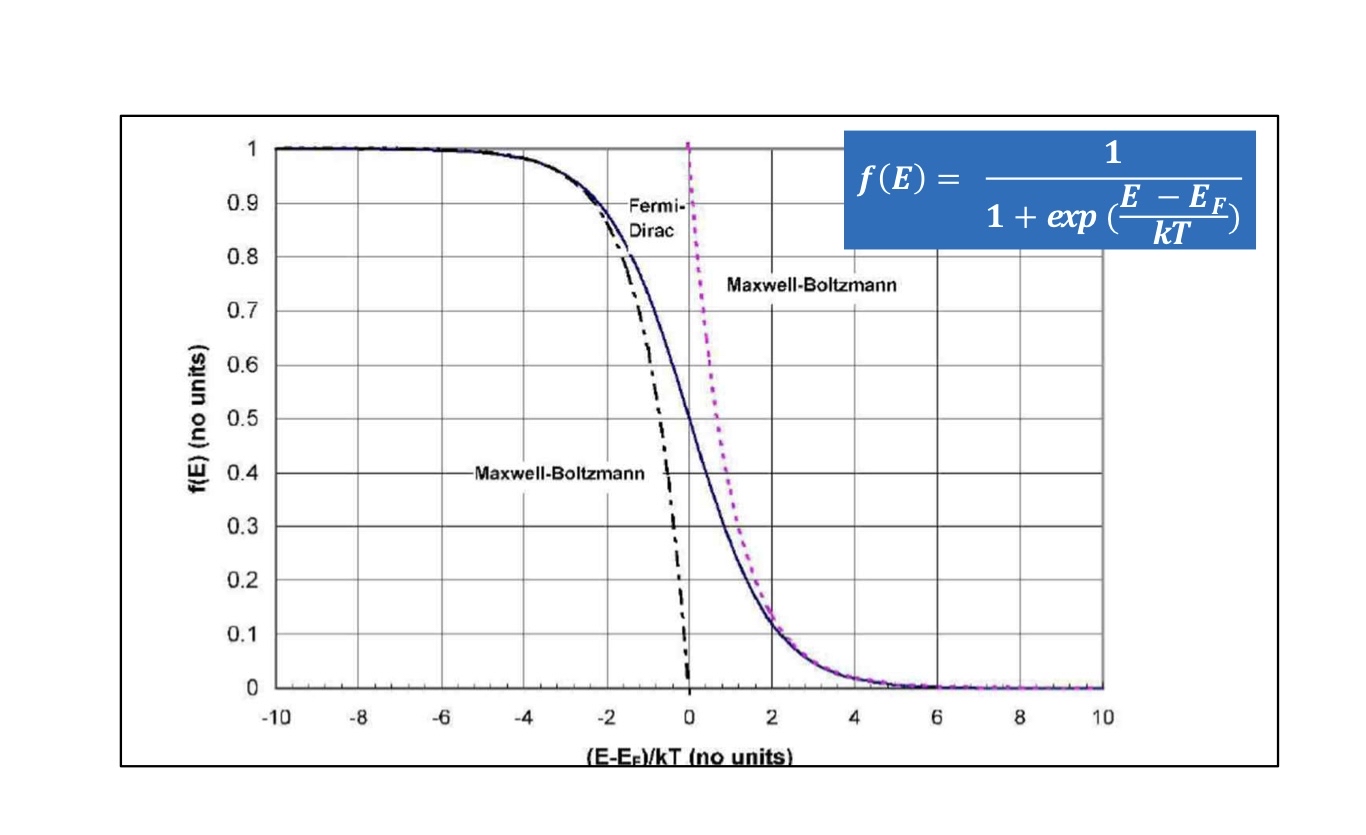
The xy axis is defined as shown in the picture below.
Step by Step Solution
There are 3 Steps involved in it
1 Expert Approved Answer
Step: 1 Unlock

Question Has Been Solved by an Expert!
Get step-by-step solutions from verified subject matter experts
Step: 2 Unlock
Step: 3 Unlock