

Question: PLOT IN MATLAB please Exercise 1. Approximation Find the range of values of the variable for which the approximation below is acceptable for scaling factors
PLOT IN MATLAB please 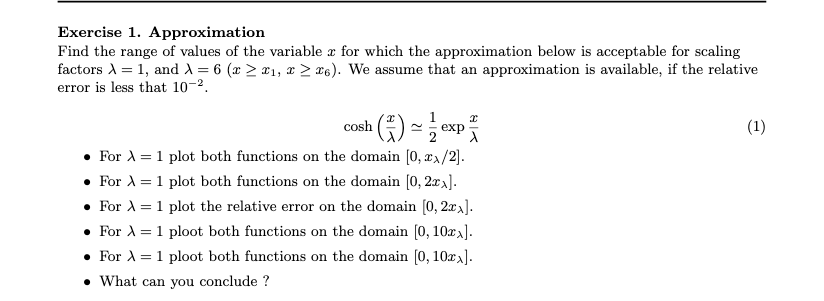
Exercise 1. Approximation Find the range of values of the variable for which the approximation below is acceptable for scaling factors X = 1, and X= 6 > 21, 2 > 26). We assume that an approximation is available, if the relative error is less that 10-2 For = 1 plot both functions on the domain (0, xx/2). For = 1 plot both functions on the domain (0,2xx). For = 1 plot the relative error on the domain (0, 2cx). For = 1 ploot both functions on the domain (0, 10xx). For = 1 ploot both functions on the domain (0, 10xx]. What can you conclude ? Exercise 1. Approximation Find the range of values of the variable for which the approximation below is acceptable for scaling factors X = 1, and X= 6 > 21, 2 > 26). We assume that an approximation is available, if the relative error is less that 10-2 For = 1 plot both functions on the domain (0, xx/2). For = 1 plot both functions on the domain (0,2xx). For = 1 plot the relative error on the domain (0, 2cx). For = 1 ploot both functions on the domain (0, 10xx). For = 1 ploot both functions on the domain (0, 10xx]. What can you conclude
Step by Step Solution
There are 3 Steps involved in it

Get step-by-step solutions from verified subject matter experts