

Question: plot in MATLAB the original function f ( x ) = 1 1 - x , and the partial sums f N ( x )
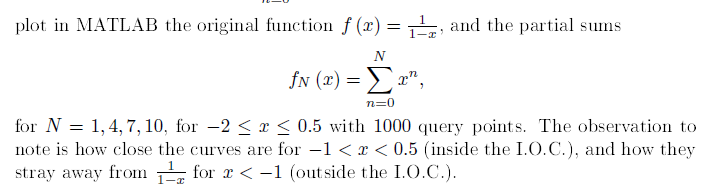
plot in MATLAB the original function and the partial sums
for for with query points. The observation to
note is how close the curves are for the I. and how they
stray away from for the I.
Step by Step Solution
There are 3 Steps involved in it
1 Expert Approved Answer
Step: 1 Unlock

Question Has Been Solved by an Expert!
Get step-by-step solutions from verified subject matter experts
Step: 2 Unlock
Step: 3 Unlock