

Question: Plot Matlab Fourier Transform: Using m = 16 Create Matlab Plot 2 -t+1 82(1) = si (t) x cos(2nmt) S1(f - m) 2 Si(f+ m)
Plot Matlab Fourier Transform:
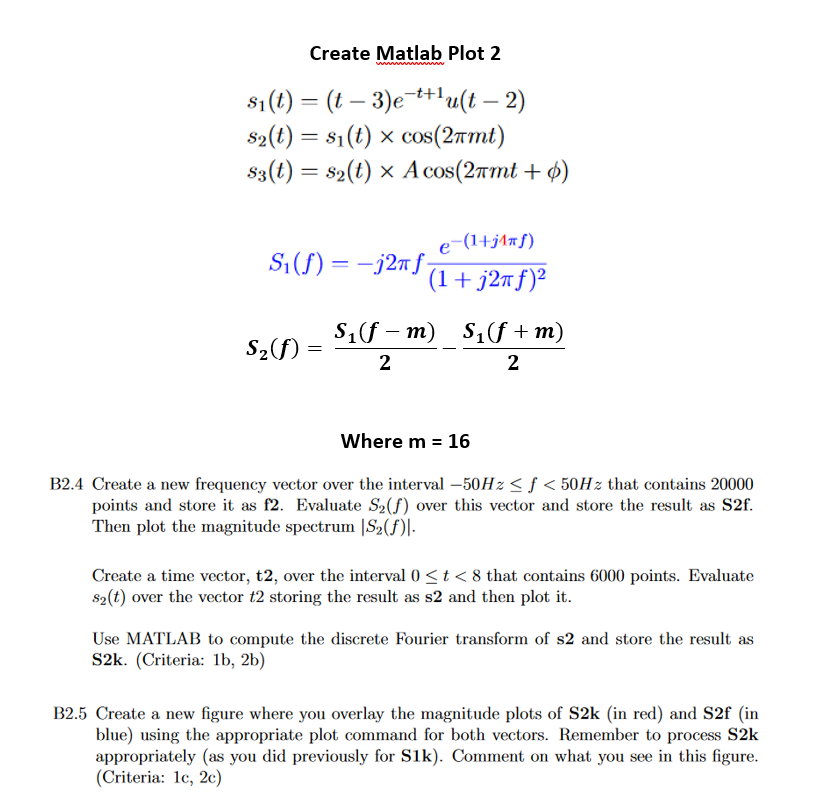
Using m = 16
Create Matlab Plot 2 -t+1 82(1) = si (t) x cos(2nmt) S1(f - m) 2 Si(f+ m) 2 Where m 16 B2.4 Create a new frequency vector over the interval-50Hz
Step by Step Solution
There are 3 Steps involved in it
1 Expert Approved Answer
Step: 1 Unlock

Question Has Been Solved by an Expert!
Get step-by-step solutions from verified subject matter experts
Step: 2 Unlock
Step: 3 Unlock