

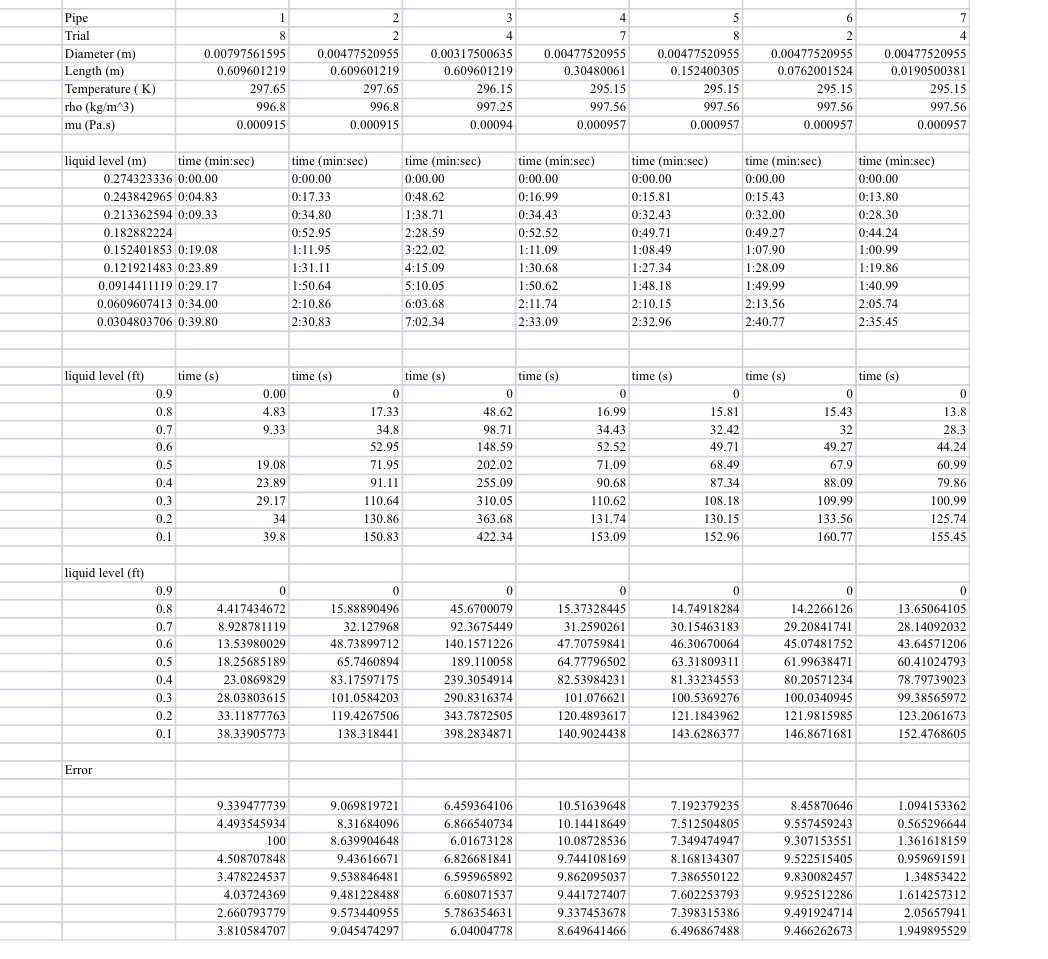
Question: Plot on excel. There should be a total of 7 plots ( 1 for each pipe ) . Each plot should have two lines graphed
Plot on excel. There should be a total of plots for each pipe Each plot should have two lines graphed one line for the experimental data and one for the theoretical data Explain step by step so I can do it if you can leave a brief explanation i will really appreciate it Thanks
Step by Step Solution
There are 3 Steps involved in it
1 Expert Approved Answer
Step: 1 Unlock

Question Has Been Solved by an Expert!
Get step-by-step solutions from verified subject matter experts
Step: 2 Unlock
Step: 3 Unlock