

Question: Plot picture is in this website https://osuecampus.shinyapps.io/interactive3/ fSelect Confidence Interval Select Standard Deviation Select Parameters # of Simulation Sample Size 90% Population 2 6 1000
Plot picture is in this website
https://osuecampus.shinyapps.io/interactive3/


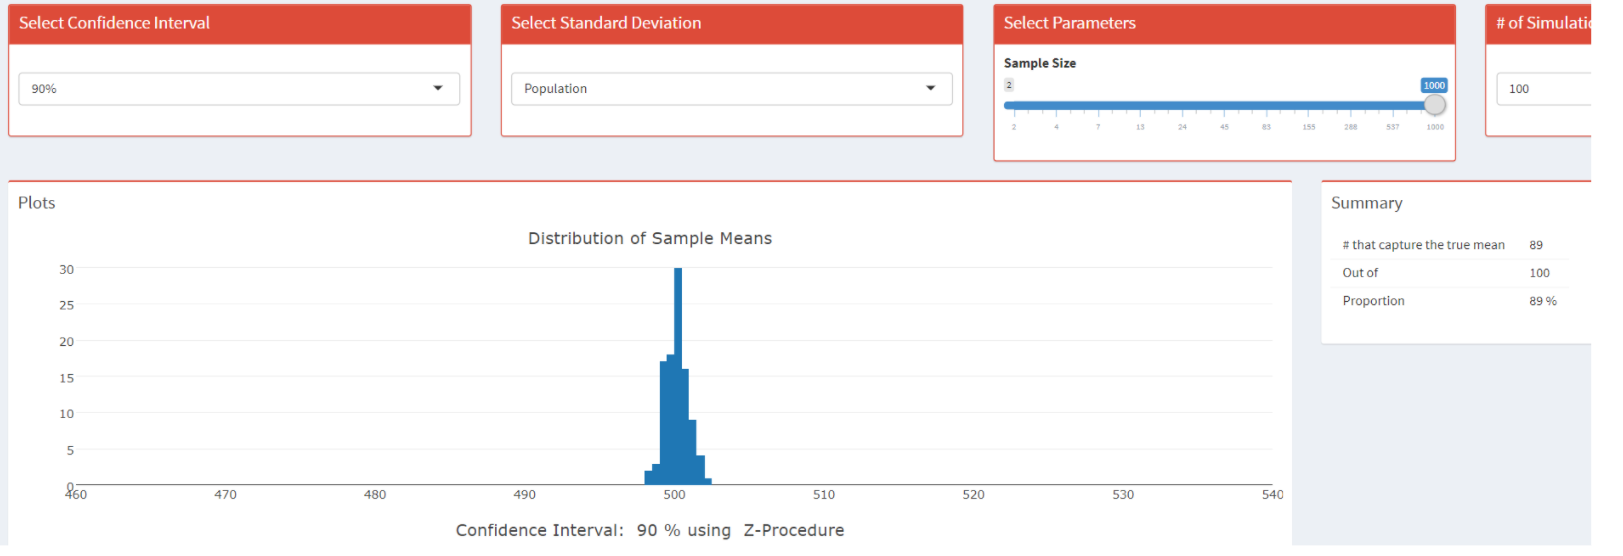

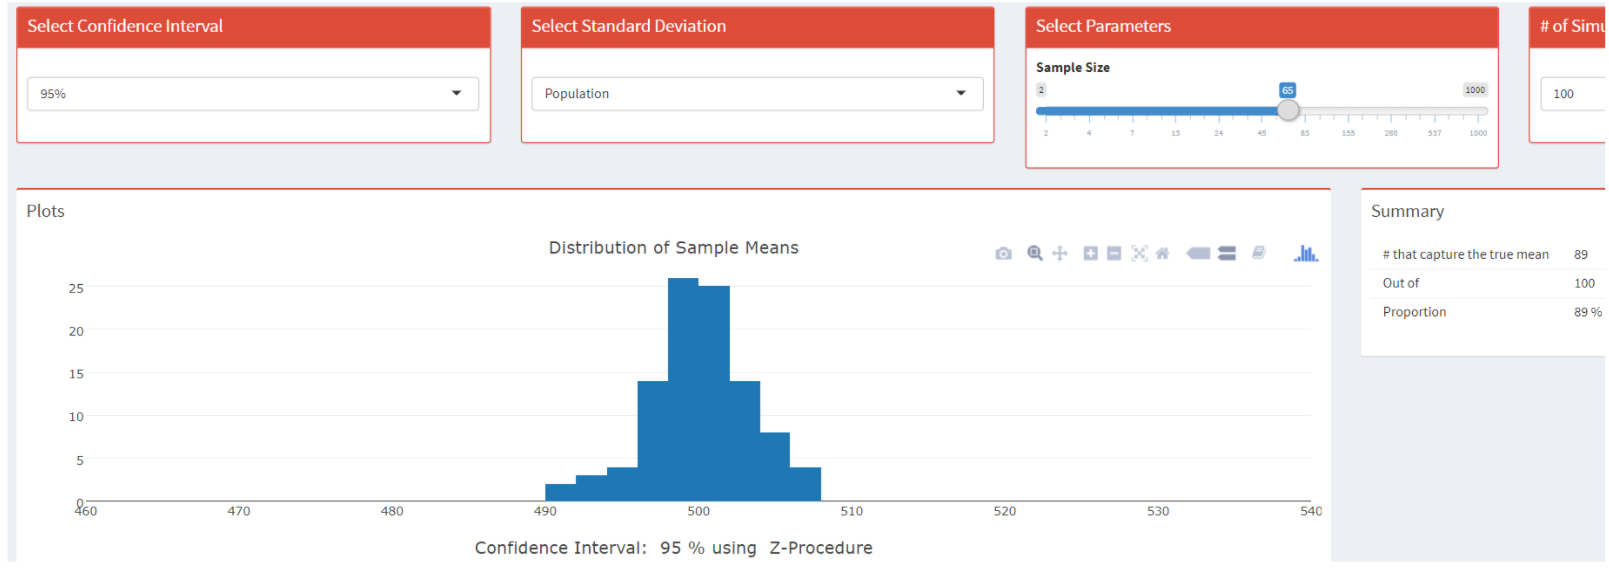
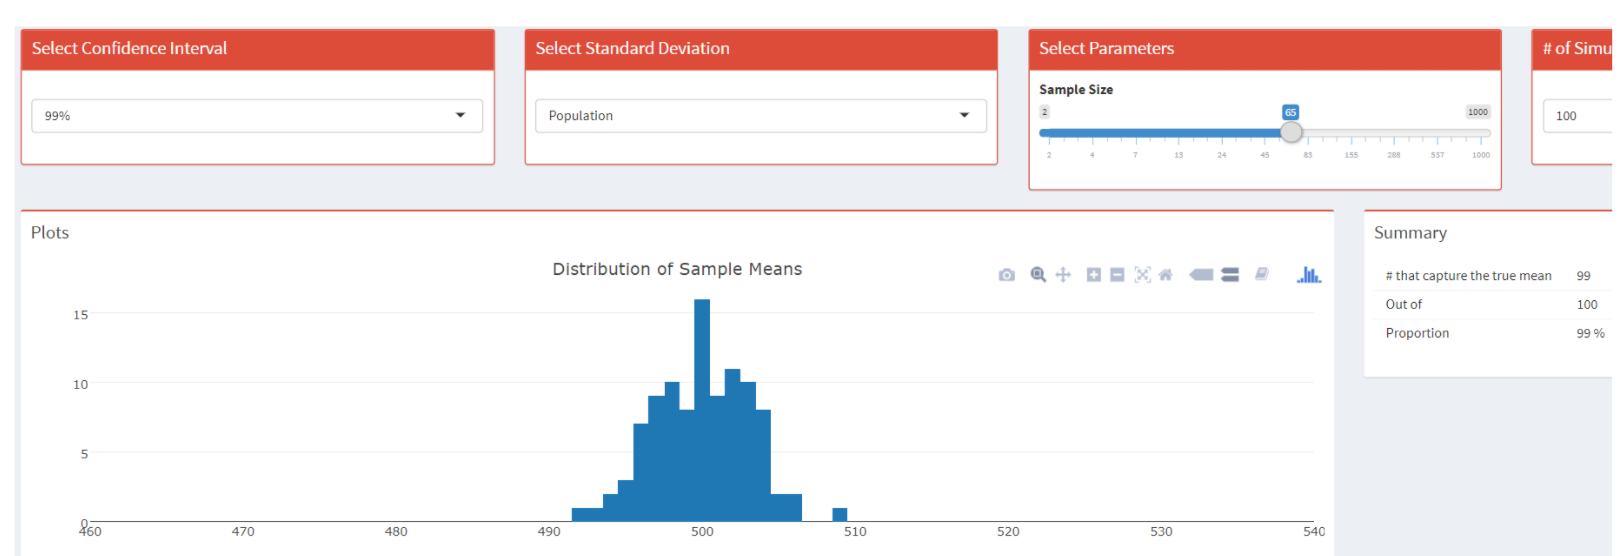
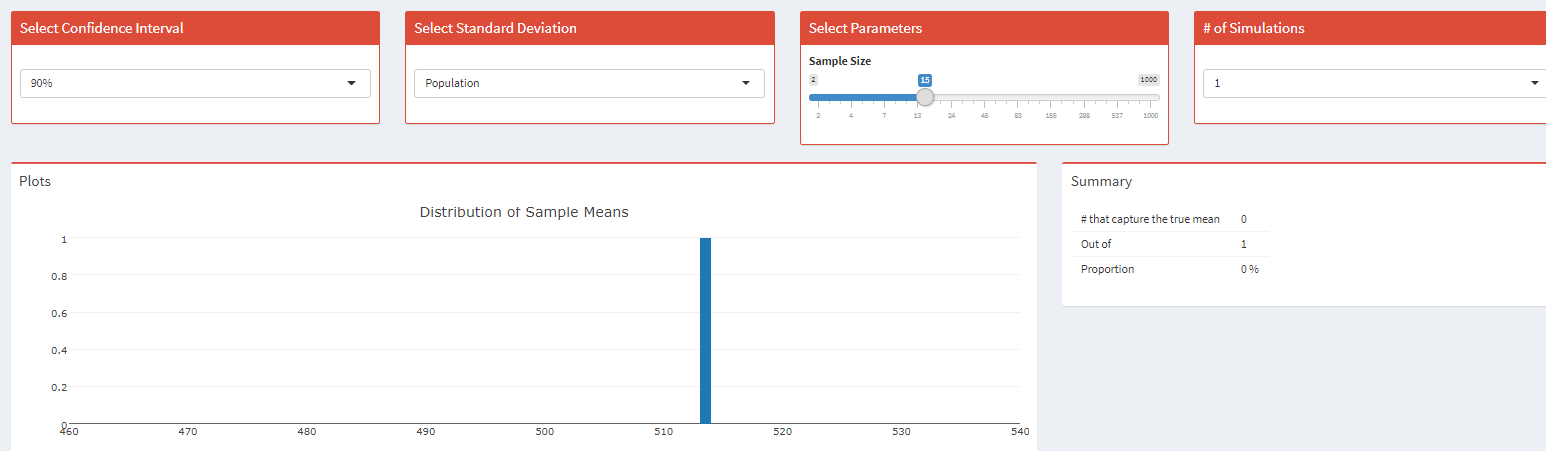


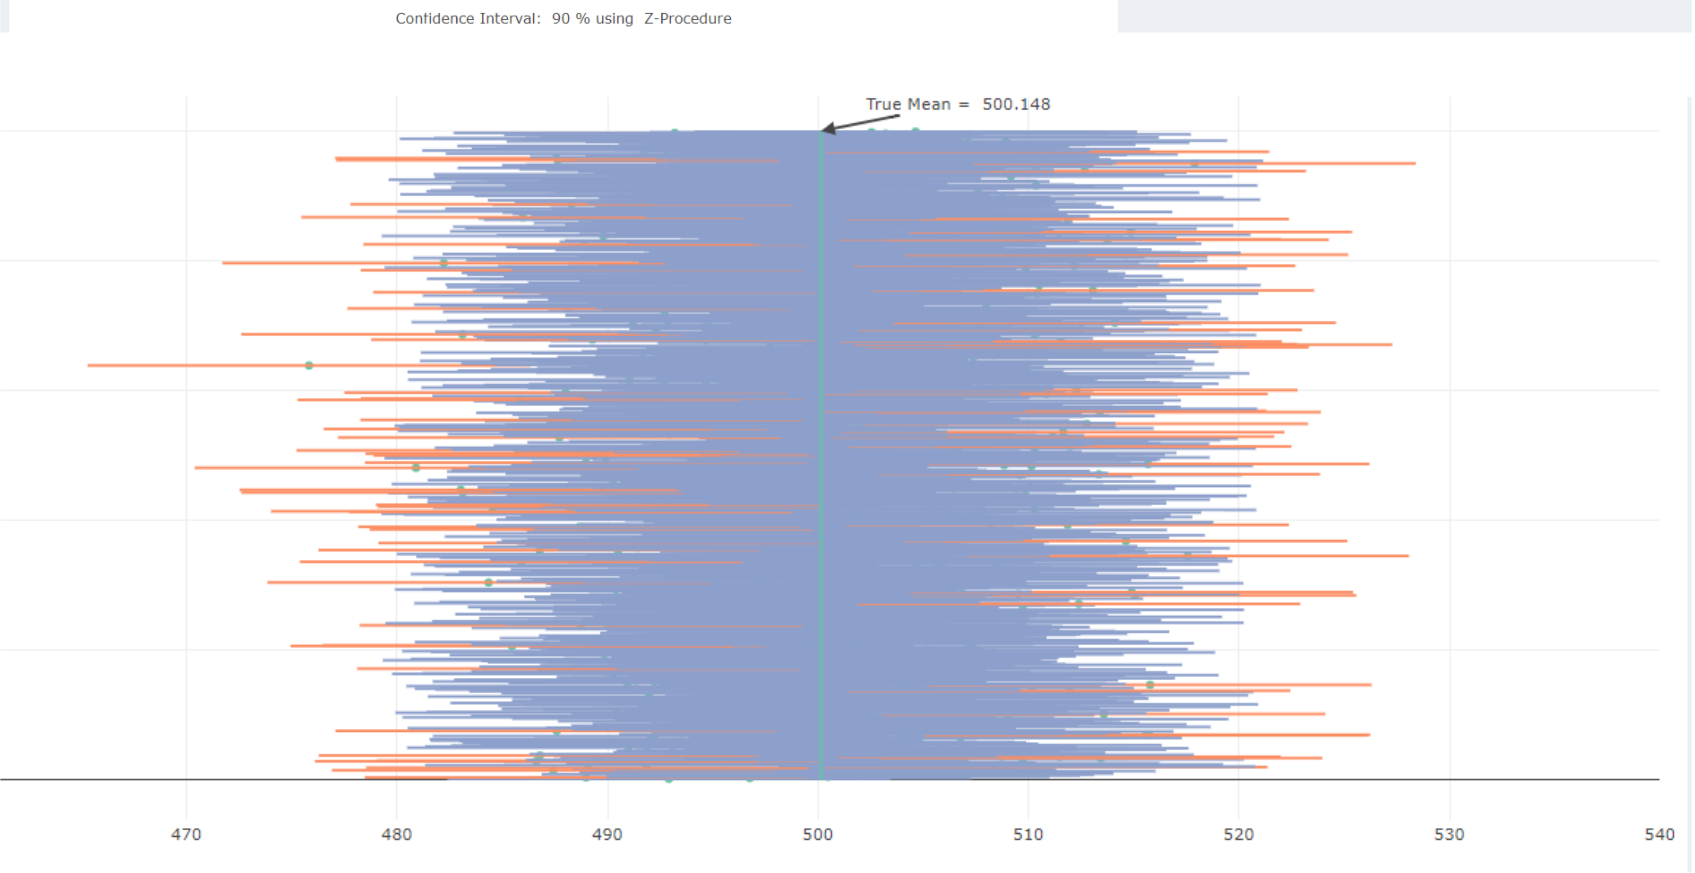

\fSelect Confidence Interval Select Standard Deviation Select Parameters # of Simulation Sample Size 90% Population 2 6 1000 100 537 1000 Plots Summary Distribution of Sample Means # that capture the true mean 91 20 Out of 100 Proportion 91 % 15 10 5 260 470 480 490 500 510 520 530 540 Confidence Interval: 90 % using Z-Procedure\fe. (1 point) How does the confidence level affect your confidence intervals? Continue with a 90% Confidence Level, "# of Simulations" at 100 and a moderate sample size between 65 30 and 100. Observe the width of your intervals. Increase the confidence level to 95% observe your intervals. Increase the confidence level to 99% observe your intervals. Select Confidence Interval Select Standard Deviation Select Parameters # of Simulation Sample Size 90% Population 2 65 1000 100 185 337 1090 Plots Summary Distribution of Sample Means # that capture the true mean 91 Out of 100 Proportion 91 % 10 860 470 480 490 500 510 520 530 540 Confidence Interval: 90 % using Z-Procedure\fSelect Confidence Interval Select Standard Deviation Select Parameters # of Simu Sample Size 99% Population 2 65 1000 100 13 24 45 83 155 288 537 1000 Plots Summary Distribution of Sample Means O Q+ + - X4 2 0 . # that capture the true mean 99 Out of 100 15 Proportion 99 % 10 460 470 480 490 500 510 520 530 540Select Confidence Interval Select Standard Deviation Select Parameters # of Simulations Sample Size 90% Population 15 1000 18 155 208 587 Plots Summary Distribution of Sample Means # that capture the true mean 0 Out of 1 B'0 Proportion 0 % 0.6 0.4 0.2 260 470 480 490 500 510 520 530 540\fSelect Confidence Interval Select Standard Deviation Select Parameters # of Simulations Sample Size 90% Population 2 1000 100 155 $37 1080 Plots Summary Distribution of Sample Means # that capture the true mean 89 40 Out of 100 Proportion 89 9% 30 20 10 860 470 480 490 500 510 520 530 540 Confidence Interval: 90 % using Z-Procedure
Step by Step Solution
There are 3 Steps involved in it

Get step-by-step solutions from verified subject matter experts