

Question: Plot the 4-in-1 residual diagnostic plot. How do you feel about the multiple regression model given this extra information. Residuals vs Fitted Scale-Location 37-3-30 20
Plot the 4-in-1 residual diagnostic plot. How do you feel about the multiple regression model given this extra information.
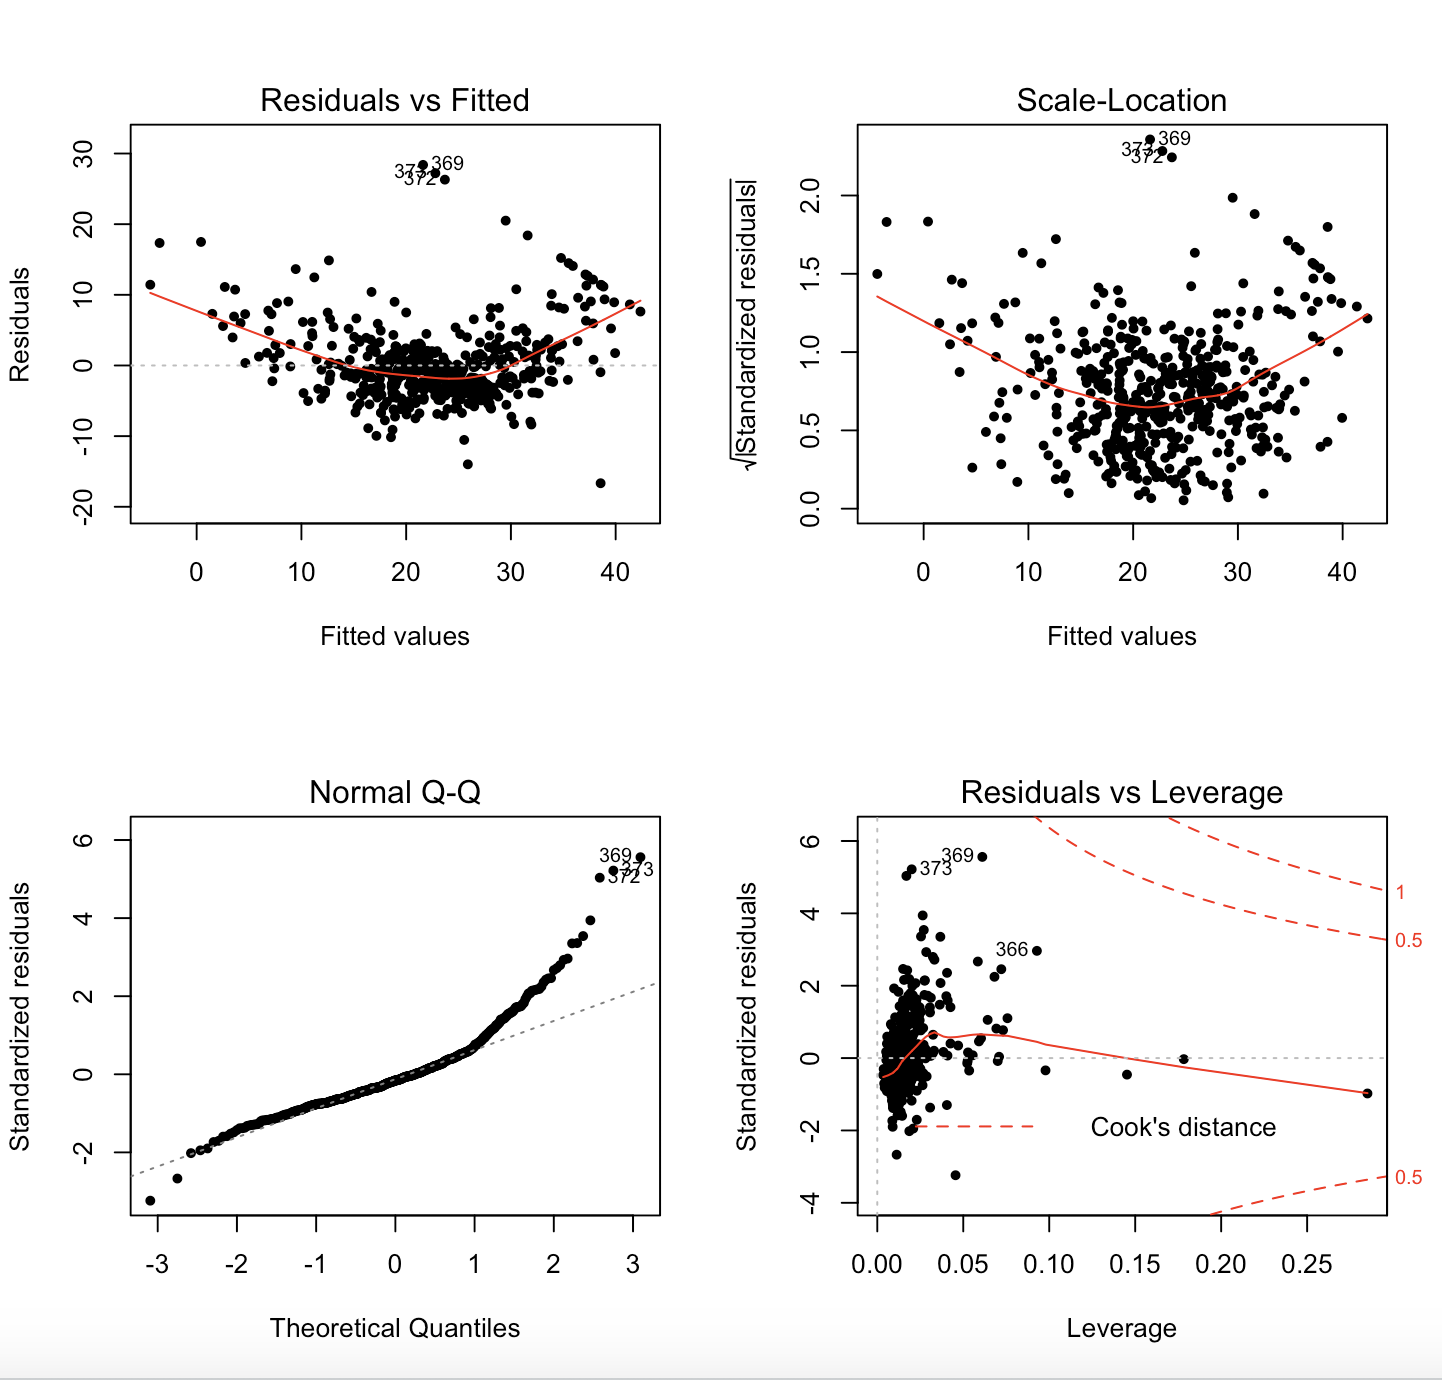
Residuals vs Fitted Scale-Location 37-3-30 20 1.5 2.0 Do go IStandardized residualsl Residuals 0 0.0 0.5 1.0 -20 -10 0 10 20 30 40 0 10 20 30 40 Fitted values Fitted values Normal Q-Q Residuals vs Leverage CC 7369. + 366 . 0.5 Standardized residuals Standardized residuals O O Cook's distance 0.5 -2 -1 0 1 2 3 0.00 0.05 0.10 0.15 0.20 0.25 Theoretical Quantiles Leverage
Step by Step Solution
There are 3 Steps involved in it
1 Expert Approved Answer
Step: 1 Unlock

Question Has Been Solved by an Expert!
Get step-by-step solutions from verified subject matter experts
Step: 2 Unlock
Step: 3 Unlock