

Question: plot the average debt ratios for all firms over time. Plot average debt ratios ( in the lastrow of the table ) ?on Y axis
plot the average debt ratios for all firms over time. Plot average debt ratios in the lastrow of the table ?on Y axis and year on X axis. Compared to the average debt ratio for SP ?which is ?do these responsible firms use lessdebt less resources constrained ?or more debtmore resource constrained ?Why do you thinkthat these highly responsible firms are moreless resourceconstrained?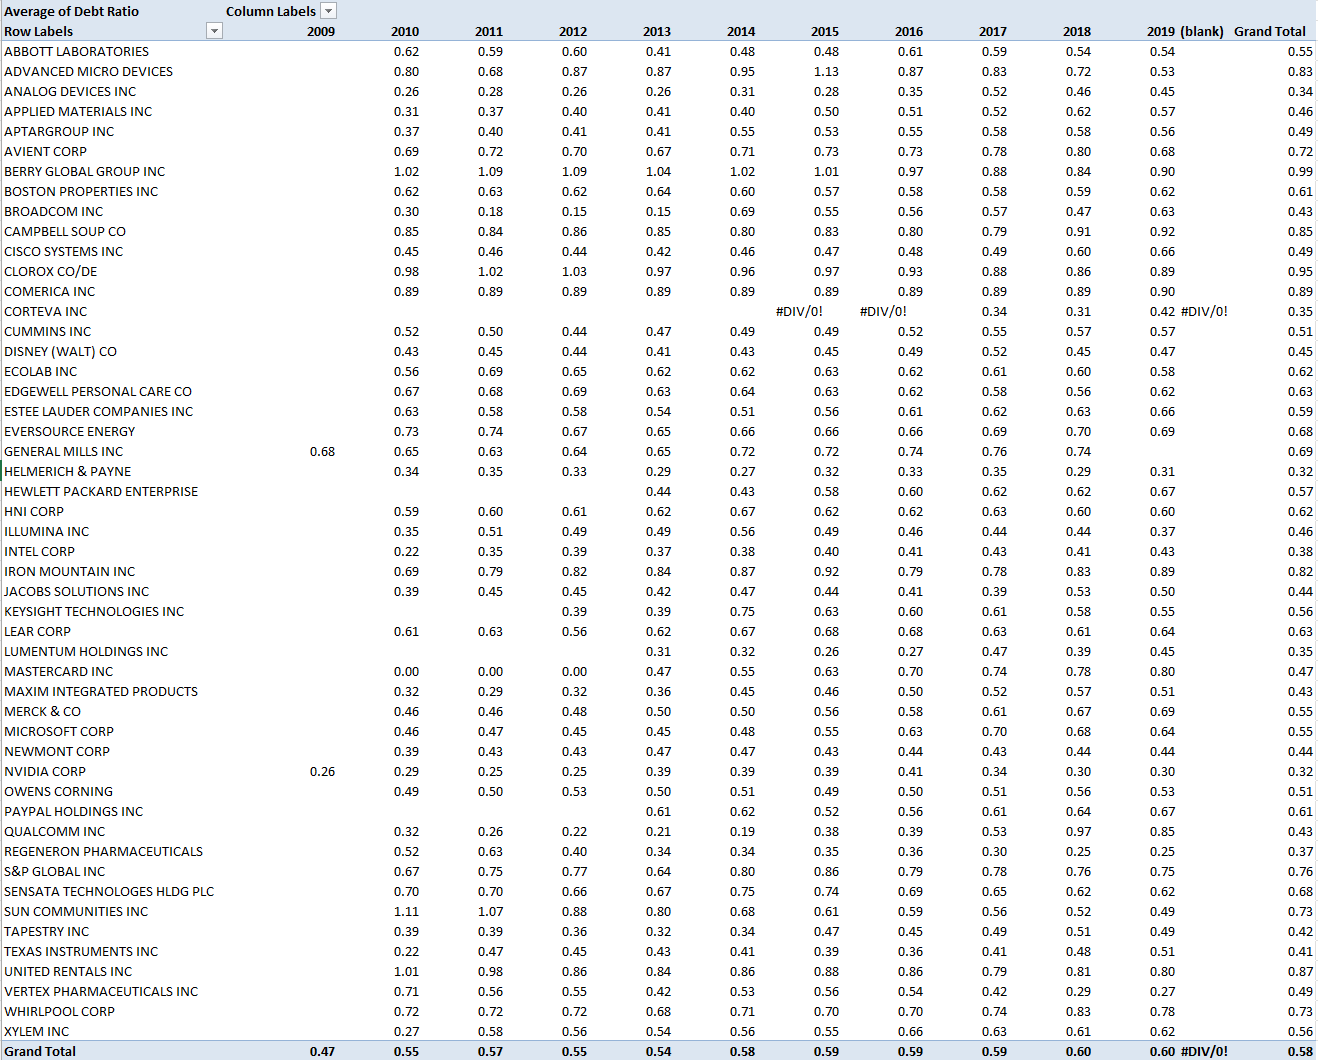
Average of Debt Ratio Column Labels Row Labels 2009 2010 2011 2012 2013 2014 2015 2016 2017 2018 2019 (blank) Grand Total ABBOTT LABORATORIES 0.62 0.59 0.60 0.41 0.48 0.48 0.61 0.59 0.54 0.54 0.55 ADVANCED MICRO DEVICES 0.80 0.68 0.87 0.87 0.95 1.13 0.87 0.83 0.72 0.53 0.83 ANALOG DEVICES INC 0.26 0.28 0.26 0.26 0.31 0.28 0.35 0.52 0.46 0.45 0.34 APPLIED MATERIALS INC 0.31 0.37 0.40 0.41 0.40 0.50 0.51 0.52 0.62 0.57 0.46 APTARGROUP INC 0.37 0.40 0.41 0.41 0.55 0.53 0.55 0.58 0.58 0.56 0.49 AVIENT CORP 0.69 0.72 0.70 0.67 0.71 0.73 0.73 0.78 0.80 0.68 0.72 BERRY GLOBAL GROUP INC 1.02 1.09 1.09 1.04 1.02 1.01 0.97 0.88 0.84 0.90 0.99 BOSTON PROPERTIES INC 0.62 0.63 0.62 0.64 0.60 0.57 0.58 0.58 0.59 0.62 0.61 BROADCOM INC 0.30 0.18 0.15 0.15 0.69 0.55 0.56 0.57 0.47 0.63 0.43 CAMPBELL SOUP CO 0.85 0.84 0.86 0.85 0.80 0.83 0.80 0.79 0.91 0.92 0.85 CISCO SYSTEMS INC CLOROX CO/DE COMERICA INC CORTEVA INC CUMMINS INC DISNEY (WALT) CO 0.45 0.46 0.44 0.42 0.46 0.47 0.48 0.49 0.60 0.66 0.49 0.98 1.02 1.03 0.97 0.96 0.97 0.93 0.88 0.86 0.89 0.95 0.89 0.89 0.89 0.89 0.89 0.89 0.89 0.89 0.89 0.90 0.89 #DIV/0! #DIV/0! 0.34 0.31 0.42 #DIV/0! 0.35 0.52 0.50 0.44 0.47 0.49 0.49 0.52 0.55 0.57 0.57 0.51 0.43 0.45 0.44 0.41 0.43 0.45 0.49 0.52 0.45 0.47 0.45 ECOLAB INC EDGEWELL PERSONAL CARE CO ESTEE LAUDER COMPANIES INC EVERSOURCE ENERGY GENERAL MILLS INC HELMERICH & PAYNE HEWLETT PACKARD ENTERPRISE HNI CORP ILLUMINA INC 0.56 0.69 0.65 0.62 0.62 0.63 0.62 0.61 0.60 0.58 0.62 0.67 0.68 0.69 0.63 0.64 0.63 0.62 0.58 0.56 0.62 0.63 0.63 0.58 0.58 0.54 0.51 0.56 0.61 0.62 0.63 0.66 0.59 0.73 0.74 0.67 0.65 0.66 0.66 0.66 0.69 0.70 0.69 0.68 0.68 0.65 0.63 0.64 0.65 0.72 0.72 0.74 0.76 0.74 0.69 0.34 0.35 0.33 0.29 0.27 0.32 0.33 0.35 0.29 0.31 0.32 0.44 0.43 0.58 0.60 0.62 0.62 0.67 0.57 0.59 0.60 0.61 0.62 0.67 0.62 0.62 0.63 0.60 0.60 0.62 0.35 0.51 0.49 0.49 0.56 0.49 0.46 0.44 0.44 0.37 0.46 INTEL CORP 0.22 0.35 0.39 0.37 0.38 0.40 0.41 0.43 0.41 0.43 0.38 IRON MOUNTAIN INC 0.69 0.79 0.82 0.84 0.87 0.92 0.79 0.78 0.83 0.89 0.82 JACOBS SOLUTIONS INC 0.39 0.45 0.45 0.42 0.47 0.44 0.41 0.39 0.53 0.50 0.44 KEYSIGHT TECHNOLOGIES INC 0.39 0.39 0.75 0.63 0.60 0.61 0.58 0.55 0.56 LEAR CORP 0.61 0.63 0.56 0.62 0.67 0.68 0.68 0.63 0.61 0.64 0.63 LUMENTUM HOLDINGS INC 0.31 0.32 0.26 0.27 0.47 0.39 0.45 0.35 MASTERCARD INC 0.00 0.00 0.00 0.47 0.55 0.63 0.70 0.74 0.78 0.80 0.47 MAXIM INTEGRATED PRODUCTS 0.32 0.29 0.32 0.36 0.45 0.46 0.50 0.52 0.57 0.51 0.43 MERCK & CO 0.46 0.46 0.48 0.50 0.50 0.56 0.58 0.61 0.67 0.69 0.55 MICROSOFT CORP 0.46 0.47 0.45 0.45 0.48 0.55 0.63 0.70 0.68 0.64 0.55 NEWMONT CORP 0.39 0.43 0.43 0.47 0.47 0.43 0.44 0.43 0.44 0.44 0.44 NVIDIA CORP 0.26 0.29 0.25 0.25 0.39 0.39 0.39 0.41 0.34 0.30 0.30 0.32 OWENS CORNING 0.49 0.50 0.53 0.50 0.51 0.49 0.50 0.51 0.56 0.53 0.51 PAYPAL HOLDINGS INC 0.61 0.62 0.52 0.56 0.61 0.64 0.67 0.61 QUALCOMM INC 0.32 0.26 0.22 0.21 0.19 0.38 0.39 0.53 0.97 0.85 0.43 REGENERON PHARMACEUTICALS 0.52 0.63 0.40 0.34 0.34 0.35 0.36 0.30 0.25 0.25 0.37 S&P GLOBAL INC 0.67 0.75 0.77 0.64 0.80 0.86 0.79 0.78 0.76 0.75 0.76 SENSATA TECHNOLOGES HLDG PLC 0.70 0.70 0.66 0.67 0.75 0.74 0.69 0.65 0.62 0.62 0.68 SUN COMMUNITIES INC 1.11 1.07 0.88 0.80 0.68 0.61 0.59 0.56 0.52 0.49 0.73 TAPESTRY INC 0.39 0.39 0.36 0.32 0.34 0.47 0.45 0.49 0.51 0.49 0.42 TEXAS INSTRUMENTS INC 0.22 0.47 0.45 0.43 0.41 0.39 0.36 0.41 0.48 0.51 0.41 UNITED RENTALS INC 1.01 0.98 0.86 0.84 0.86 0.88 0.86 0.79 0.81 0.80 0.87 VERTEX PHARMACEUTICALS INC 0.71 0.56 0.55 0.42 0.53 0.56 0.54 0.42 0.29 0.27 0.49 WHIRLPOOL CORP 0.72 0.72 0.72 0.68 0.71 0.70 0.70 0.74 0.83 0.78 0.73 XYLEM INC 0.27 0.58 0.56 0.54 0.56 0.55 0.66 0.63 0.61 0.62 0.56 Grand Total 0.47 0.55 0.57 0.55 0.54 0.58 0.59 0.59 0.59 0.60 0.60 #DIV/0! 0.58
Step by Step Solution
There are 3 Steps involved in it

Get step-by-step solutions from verified subject matter experts