

Question: Plot the correct answer in the graph: A. Long Put $40 + long call $40 B. Long call $20 + short call $35 C. Long
Plot the correct answer in the graph:
A. Long Put $40 + long call $40
B. Long call $20 + short call $35
C. Long call $40 + Short call $50
D. Long put $40
E. Short call $25 + Long Call $35 + Long Call $35 + Short Call $45
F. Long underlying $20 + short call $20
G. Long call $25 + Short call $35+Short call $35 + long call $45
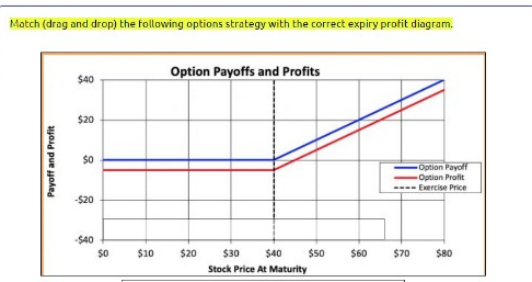
H. Long call $40
I. Short call $40+ Short Put $40
J. Long Put $40 + Long call $50
Match (drag and drop) the following options strategy with the correct expiry profit diagram. Option Payoffs and Profits $40 $20 Payoff and Profit $0 Option Payoff -Option Profit - Exercise Price -$20 $40 $0 $10 $20 $60 $70 $80 $30 $40 $50 Stock Price At Maturity
Step by Step Solution
There are 3 Steps involved in it

Get step-by-step solutions from verified subject matter experts